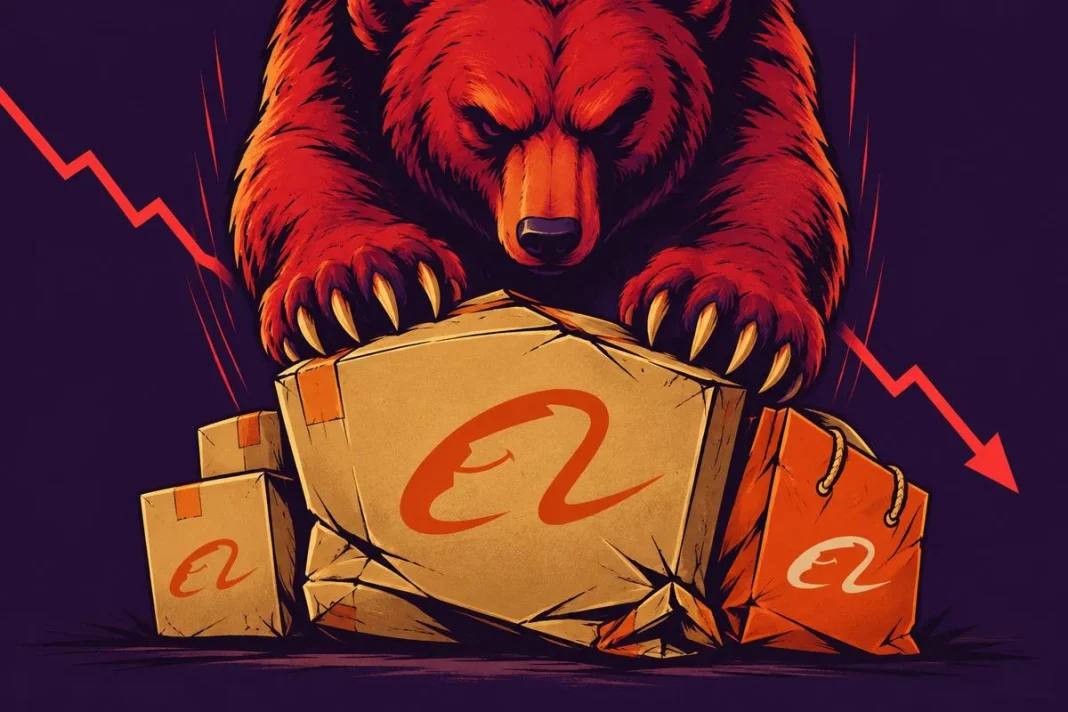

Alibaba Group stock was trading at $95 as of 11:12 ET on Thursday, below its daily exponential averages and just above its lower Bollinger band. The daily chart shows a bearish structure, while intraday RSI14 readings of 16.39 (hourly) and 19.08 (15-minute) offer limited counterweight. BABA opened at $95.64, traded between a low of $93.46 and a high of $95.83, and was last at $95.00, against a previous close of $101.52.

Key takeaways
- Alibaba Group stock was trading at $95 as of 11:12 ET, versus the previous close of $101.52 on November 11.
- Daily RSI14 is 34.3, below the neutral 50 but above the oversold 30 threshold.
- Daily MACD line at -1.89 is below its signal at -1.76; the histogram is -0.13.
- Price sits just above the daily lower Bollinger band at $94.97, beneath all three daily EMAs.
- Hourly RSI14 is 16.39 and 15-minute RSI14 is 19.08; both are in oversold territory.
- Daily ATR14 is $3.66, compared with $3.32 in the prior reading.
On Thursday, November 12, 2026, BABA opened at $95.64, with an intraday range of $93.46 to $95.83. The move stood at -6.42% versus the previous close of $101.52 on November 11, 2026.
Alibaba Group Stock: Daily Structure Favors the Bearish Case
The daily chart shows a decisively bearish structure for Alibaba Group stock. Price sits below all three exponential moving averages.
The daily averages are bearishly aligned. Price is below the 20-session EMA at $103.54. That average sits below the 50-session EMA at $107.28 and the 200-session EMA at $119.97. This ordering leaves the main trend framework unfavorable to the bullish case.
Meanwhile, daily RSI14 stands at 34.3, below 50 but above the oversold threshold of 30. The daily MACD line is -1.89, below its signal at -1.76, with a negative histogram of -0.13. Both readings support the bearish daily assessment without establishing an oversold daily condition.
Price sits just above the daily lower Bollinger band at $94.97. It remains beneath the mid band at $103.02 and upper band at $111.08. This places BABA near the lower boundary of its daily volatility envelope. Daily ATR14 increased to $3.66 from $3.32, indicating greater absolute volatility than in the preceding reading.
Notably, price is below the daily first support (S1) at $100.95. The daily pivot at $101.62 and first resistance (R1) at $102.20 also stand overhead. These levels, calculated from the previous completed daily candle, define additional barriers for the current session.
Hourly Confirmation, With a Short-Term Conflict
The hourly chart confirms the bearish daily structure. However, RSI14 readings of 16.39 (hourly) and 19.08 (15-minute) introduce a short-term conflict.
Hourly Trend Structure
The hourly averages confirm the daily bearish structure. Price is below the 20-hour EMA at $101.59, the 50-hour EMA at $103.11, and the 200-hour EMA at $105.13. Their bearish alignment leaves no trend confirmation for a bullish case on this timeframe.
However, hourly RSI14 rose to 16.39 from 13.96, while remaining oversold. The hourly MACD histogram fell to -0.74 from -0.56. Its line at -2.02 remains below the signal at -1.28. The conflict is specific: RSI improved, but the MACD histogram became more negative.
Price is also below the hourly lower Bollinger band at $96.53, while holding above the hourly pivot at $94.65. Hourly first resistance (R1) stands at $95.85, and first support (S1) is $93.48. Hourly RSI14 at 16.39 therefore coexists with a bearish hourly structure rather than overturning it.
15-Minute Oversold Readings
In contrast, the 15-minute MACD histogram increased to -0.58 from -0.69, although it remains negative. The 15-minute RSI14 rose to 19.08 from 14.28 and remains oversold. These readings provide a narrow counterpoint to the hourly histogram, not a change in the daily bias.
For short-term execution context, price sits above the 15-minute pivot at $94.54 and first resistance (R1) at $94.82. First support (S1) is $94.33. Yet price remains below the 20-quarter-hour EMA at $98.18. This limits the bullish significance of its position above those local pivot levels.
AI Policy and Earnings Frame the News Backdrop
News flow around Alibaba Group stock centered on regulatory proposals and the upcoming earnings release.
Reports published before Thursday’s open said the U.S. Commerce Department was preparing rules on Chinese AI companies. The rules would restrict remote access to advanced semiconductors through data centers. That is a reported policy proposal, not an enacted restriction. Another pre-open report described Alibaba Group’s effort to obtain outside funding through a Hong Kong IPO for its chip business.
Meanwhile, Investing.com reported during the session that Alibaba shares may move 5.7% around the November 19 earnings release. That estimate is not a directional forecast. A Seeking Alpha preview published during the session argued that capital expenditure and negative free cash flow overshadow Alibaba’s cloud growth ambitions. That remains the report’s assessment, rather than an established explanation for BABA’s intraday move.
Bullish and Bearish Conditions for Alibaba Group Stock
The near-term outlook for Alibaba Group stock depends on whether price can hold above key support levels. The bearish daily framework remains intact, but intraday RSI14 readings of 16.39 (hourly) and 19.08 (15-minute) complicate the picture.
Bullish Scenario Requirements
A bullish scenario requires holding the daily lower Bollinger band at $94.97. It also needs to clear hourly first resistance at $95.85. Reclaiming the hourly lower band at $96.53 would provide further support. Beyond those barriers, daily first support at $100.95, the daily pivot at $101.62, and daily first resistance at $102.20 remain overhead. The daily 20-session EMA at $103.54 is a further test of that case.
Bearish Invalidation Levels
Conversely, a break below hourly first support at $93.48 and the session low at $93.46 would invalidate the near-term bullish case. The 15-minute lower Bollinger band at $92.54 would then be a lower reference, not a guaranteed destination. The bearish daily framework remains intact while price stays beneath its daily averages.
Overall, Alibaba Group stock stands just above the daily lower band but below every daily EMA and the daily pivot structure. Daily ATR indicates greater volatility, while intraday RSI14 readings of 16.39 (hourly) and 19.08 (15-minute) complicate the bearish picture. Whether those short-term readings can support price above the nearby hourly resistance remains unresolved.
FAQ
What is the current price of Alibaba Group stock?
Alibaba Group stock was trading at $95 as of 11:12 ET on Thursday, November 12, 2026, versus the previous close of $101.52 on November 11.
What does the daily chart show for BABA?
The daily chart shows a bearish structure. Price is below the 20-session EMA at $103.54, the 50-session EMA at $107.28, and the 200-session EMA at $119.97. Daily RSI14 is 34.3, below 50, and the MACD histogram is negative at -0.13.
Are there any oversold signals for Alibaba Group stock?
Hourly RSI14 is 16.39 and the 15-minute RSI14 is 19.08, both in oversold territory. These provide a limited counterweight to the bearish daily structure but have not overturned it.
What key levels should traders watch?
Key support sits at the daily lower Bollinger band at $94.97, hourly first support at $93.48, and the session low at $93.46. Key resistance includes hourly first resistance at $95.85, the hourly lower band at $96.53, and daily first resistance at $102.20.
Disclaimer: This article is for informational purposes only and does not constitute financial advice, an investment recommendation, or a solicitation to buy or sell any financial instrument. The analysis provided is not indicative of future results. Investing in financial markets carries a high risk of capital loss. Always do your own research (DYOR) and consult a qualified financial advisor before making any decision.
Cryptonomist and the author hold no positions in the financial instruments mentioned and receive no compensation from the companies covered.
Article produced with the assistance of artificial intelligence and reviewed by the editorial team.