
Micron Stock remains in a dominant uptrend, but stretched momentum and a cooling intraday tape argue for near-term digestion over a straight-line advance, with elevated shakeout risk despite resilient dip buying.
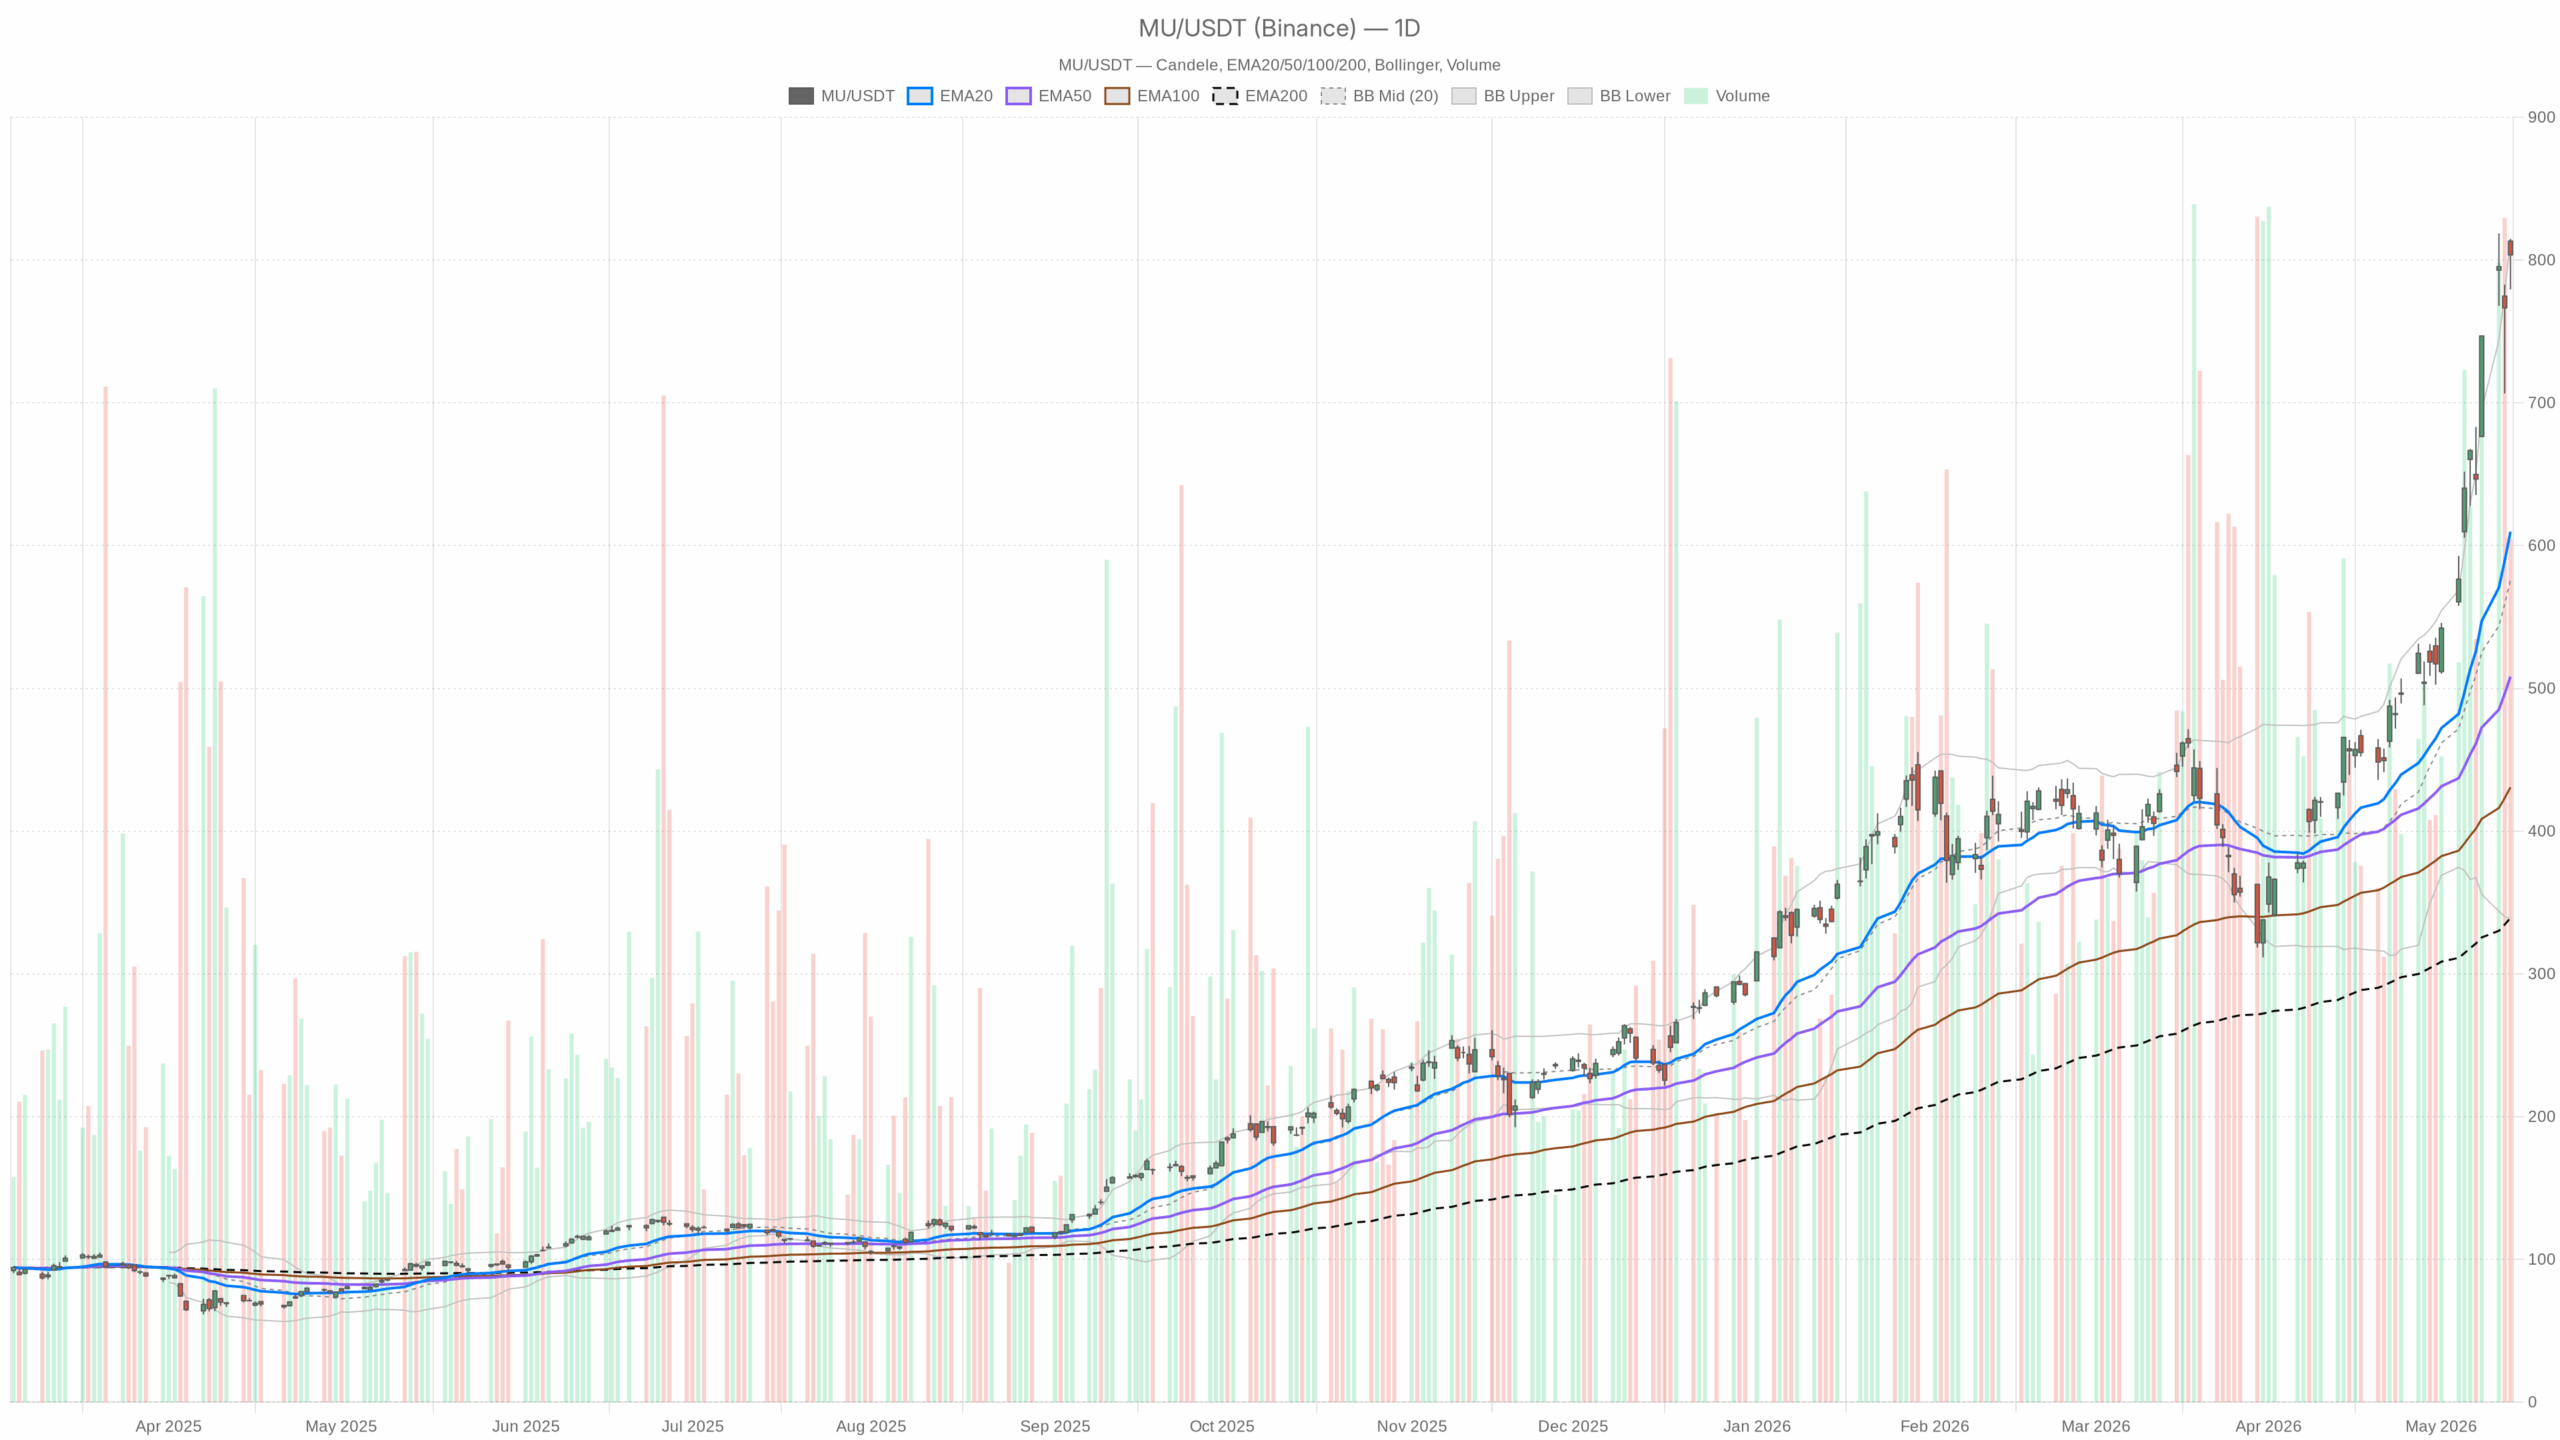
Daily trend and key levels for Micron Stock
Trend regime and momentum
On the daily chart, MU closed at 803.63 after trading between 779.47 and 814.95 on volume of 53.7M shares. Price sits well above the rising 20/50/200-day EMAs at 609.75, 508.27, and 339.19, confirming a strong, trend-led regime with deep support below.
Notably, daily RSI14 = 81.34. That is overbought and leaves the tape vulnerable to shakeouts. Meanwhile, the daily MACD line at 90.36 remains above its 64.59 signal with a positive +25.77 histogram. Persistent upside momentum is intact, though the move is becoming extended. Daily Bollinger Bands show a mid at 576.25 and an upper band at 813.94. Price pressed the upper band and closed just below it, which often precedes consolidation.
Volatility and pivots
The 14-day ATR = 51.05, underscoring elevated volatility. Therefore, swings can be fast and wide. Finally, the daily pivot is 799.35 with R1 819.23 and S1 783.75. Holding above the pivot favors bulls, while a drop toward S1 would mark a deeper pause.
News flow and sentiment context for Micron Stock
Meanwhile, the news tape continues to reinforce dip-buying behavior in Micron Stock. Yahoo Finance highlighted a roughly $100B wipeout at Tuesday’s low that was met with aggressive buying. That response underscores resilient demand for MU on weakness.
At the same time, the broader semiconductor tone improved alongside fresh U.S.–China AI‑chip headlines, per Yahoo Finance. That can amplify short-term swings but currently tilts sentiment positive. Notably, Motley Fool flagged a jaw‑dropping rally with Micron’s market cap doubling in a little over a month. The magnitude speaks to powerful momentum—and to crowded positioning risk.
Intraday: 1-hour trend and momentum
Pivot posture and EMAs
Currently, price last traded at 803.38, slightly below the H1 pivot 805.97, with R1 810.41 and S1 798.94. Sitting just under the pivot signals near‑term hesitancy. However, H1 EMAs at 771.84 (20), 714.71 (50), and 565.27 (200) are positively stacked and rising, keeping the intermediate trend pointed higher.
Oscillators and bands
H1 RSI14 = 65.28. Momentum remains bullish, but it is no longer overextended. The H1 MACD line at 25.91 sits a touch below its 26.17 signal and the histogram is −0.26. That loss of momentum hints at consolidation risk. Still, Bollinger Bands center at 778.92 with the upper at 836.57, and price holding above the mid‑band shows buyers still control the balance. The H1 ATR = 23.28, so intraday ranges remain wide and can whipsaw late entries.
Execution layer: 15-minute structure
Pivot map and EMAs
In contrast, MU closed 803.38 after a 813.00 intrabar high. The M15 pivot = 805.97 with R1 810.41 and S1 798.94. Trading below the pivot but above S1 reflects a pause within trend. Meanwhile, M15 EMAs at 797.66 (20), 782.37 (50), and 708.02 (200) remain positively aligned, and short‑term dips are being bought above the 20‑EMA.
Momentum and bands
M15 RSI14 = 57.09, which is neutral‑to‑positive but not stretched. Therefore, the minor negative M15 MACD histogram at −0.81 argues for patience on entries. The M15 Bollinger mid sits at 799.28, with the upper at 810.34. This posture favors buying pullbacks toward 799–800 if the trend holds.
Trading scenarios for Micron Stock
Primary bullish path
Therefore, the primary scenario remains bullish on the daily timeframe. A clean reclaim of the intraday pivot at 805.97 and a push through 810.41 would refocus the tape on 814.95 and then daily R1 819.23. That path would be supported by an H1 MACD cross back above signal and H1 RSI holding in the mid‑60s or higher. Continued trade above the daily pivot at 799.35 would also validate buyers’ control. In this setup, MU can attempt a controlled “band walk” along the daily upper Bollinger, though the elevated ATR argues for staggered entries.
Bearish fade risk
However, a bearish fade cannot be dismissed given stretched daily momentum. Failure to reclaim 805.97, followed by a break below 798.94 and the M15/H1 mid‑bands near 799–779, would increase downside risk toward the daily S1 783.75. That would invalidate the near‑term bullish impulse and confirm a deeper consolidation. A further deterioration in H1 MACD with RSI slipping toward 50 would strengthen the bear case, especially if price loses the daily pivot at 799.35 on a closing basis.
Final takeaway on Micron Stock
Overall, MU retains a powerful daily uptrend, but it is extended and volatile. Position sizing should respect the 51‑point daily ATR and the intraday pivot map around 806/810 and 799/799. A patient approach that leans with the trend on pullbacks remains sensible, while headline‑sensitive swings across the semiconductor complex can quickly change the tone for Micron stock and MU stock intraday.