
Mara Holdings Stock is tilting bullish on the daily chart, but it is advancing into a heavy near-term ceiling. Price reclaimed key averages and momentum improved, yet resistance around the upper Bollinger band and daily R1 could slow the next leg.
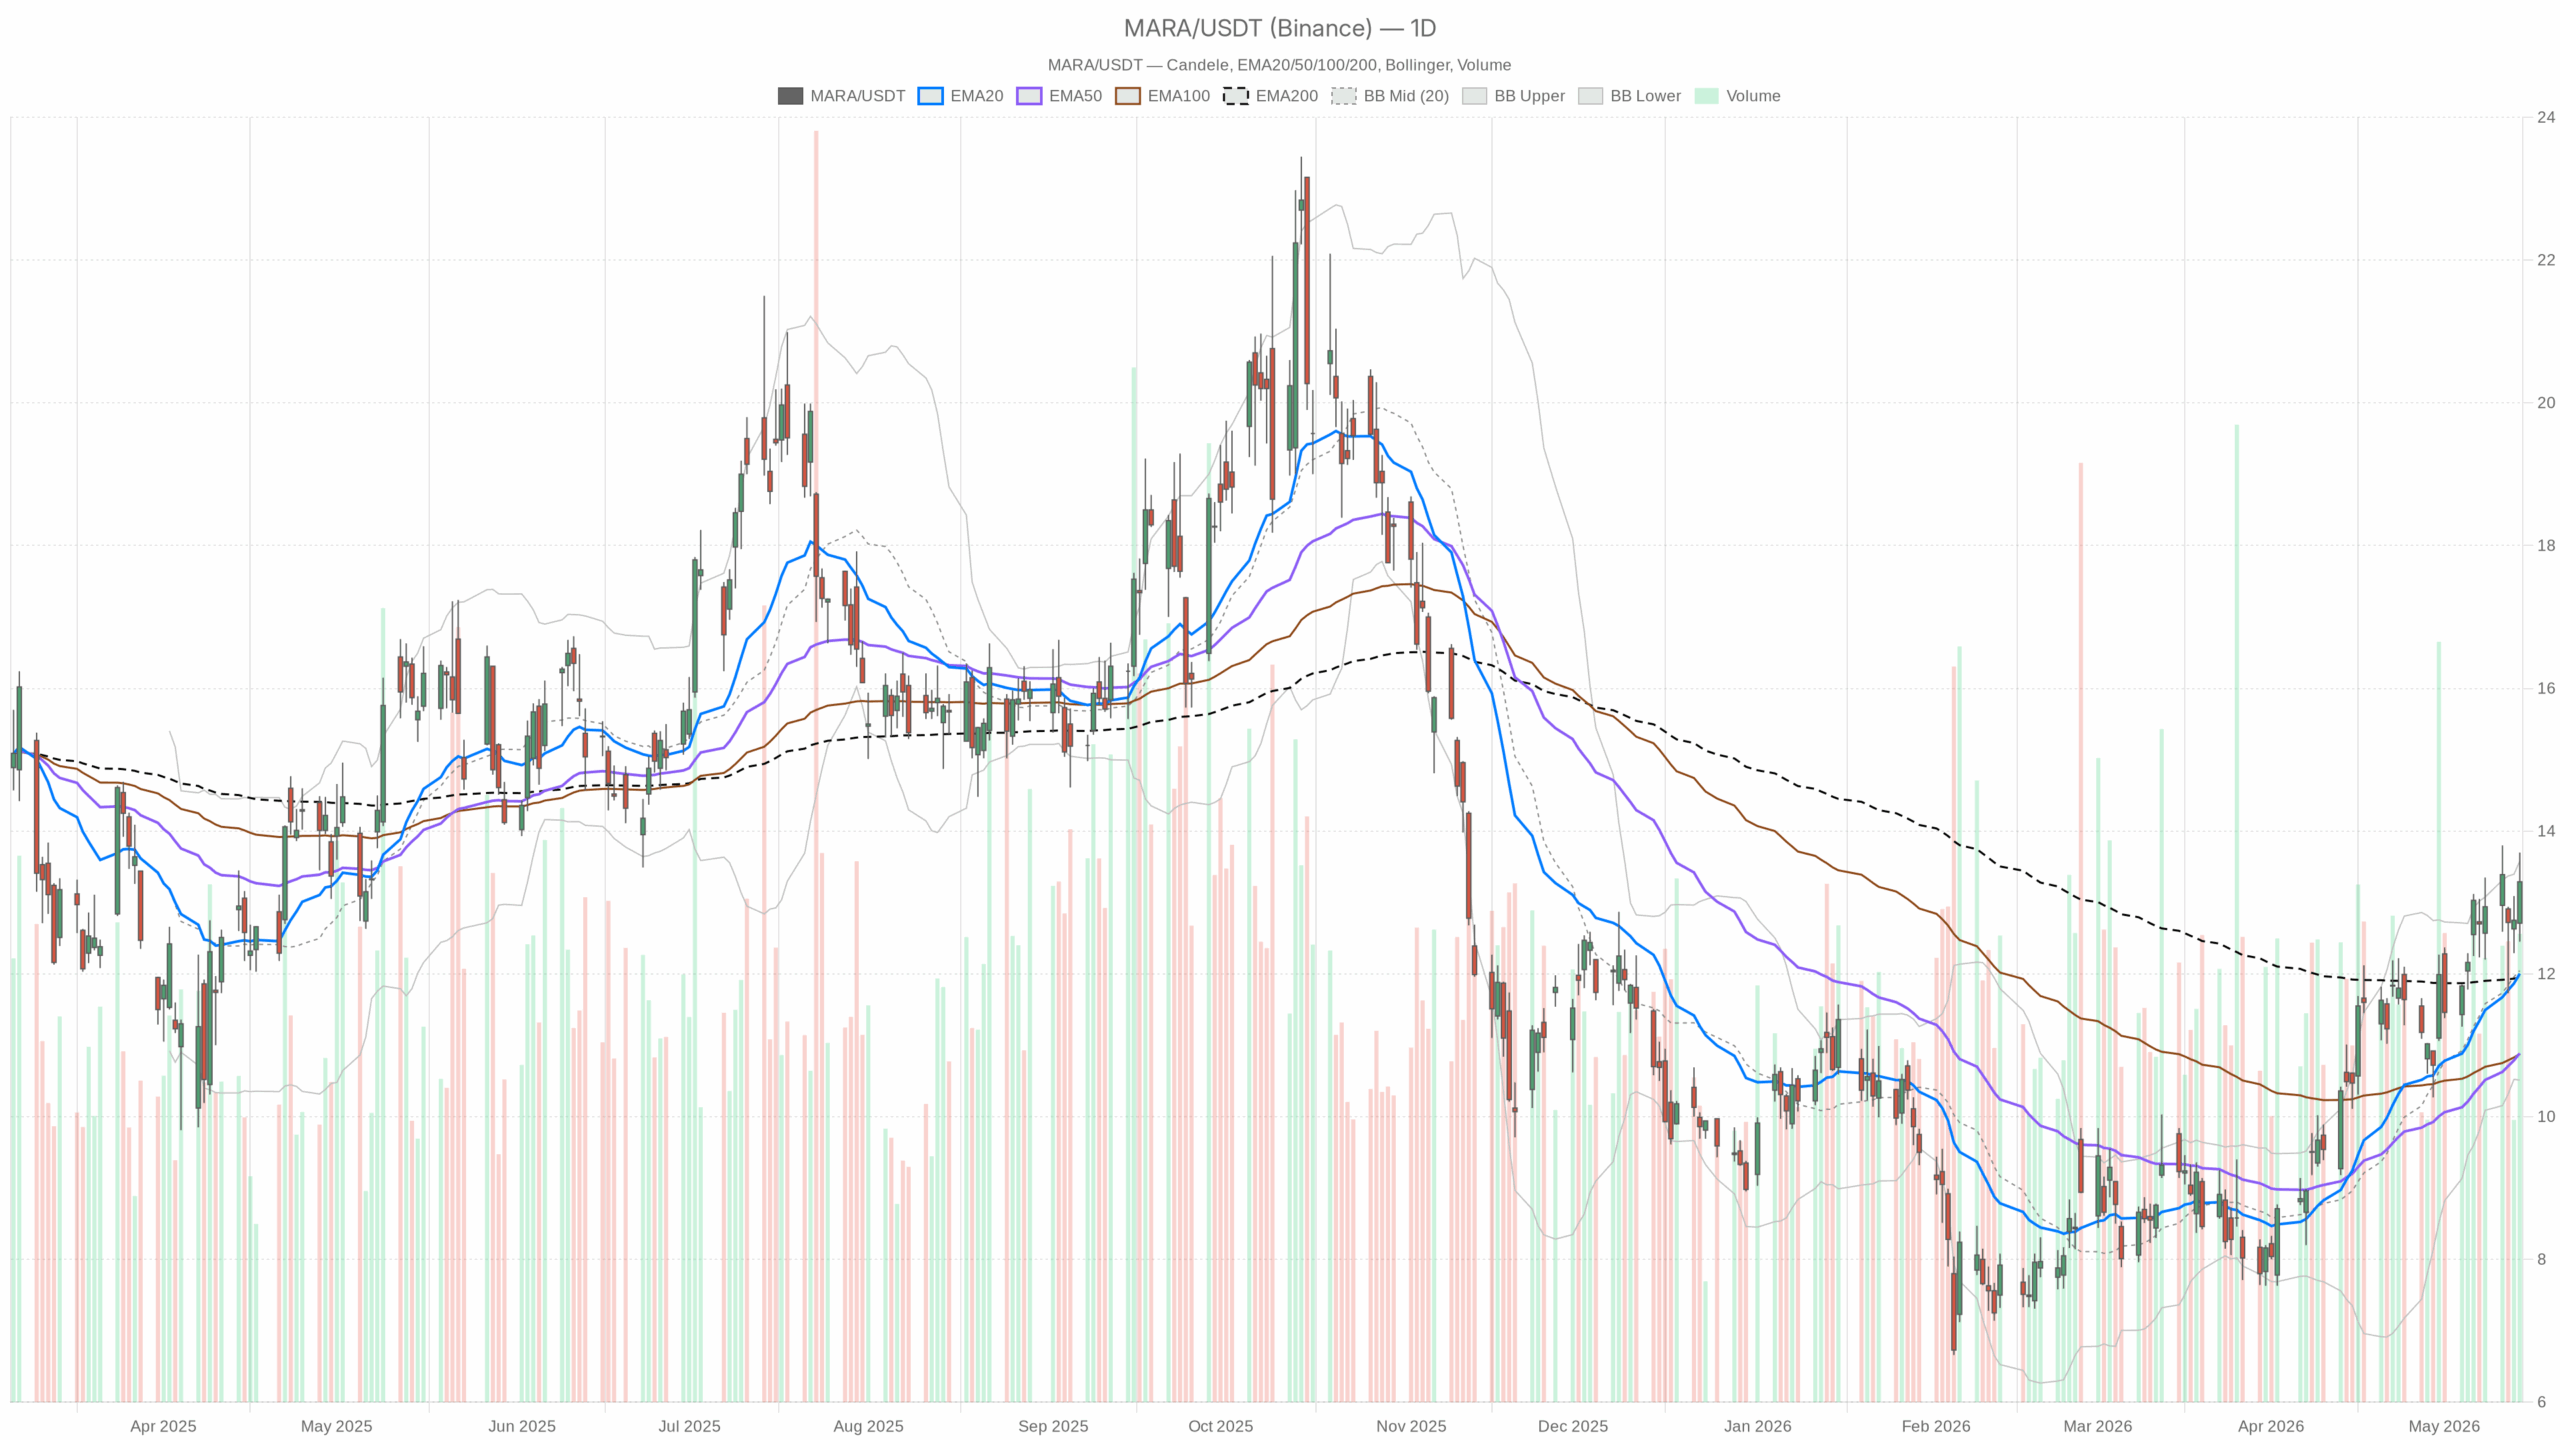
Mara Holdings Stock: Daily Technical Overview
Trend and momentum
Overall, the daily structure has turned constructive. The close at 13.29 sits above the 20-day EMA 12.00, the 50-day 10.89, and the 200-day 11.95. Price above all key trend filters supports an upside bias.
Daily RSI14 65.68 shows firm momentum that is not yet stretched. The daily MACD line is 0.83 versus a 0.79 signal with a 0.04 histogram, which is bullish but modest in impulse.
Daily Bollinger bands center at 12.05 with an upper band at 13.58. Price is near the upper band, so nearby resistance remains in play.
Volatility and pivots
The ATR14 0.96 signals wide ranges and elevated volatility. Daily pivot levels show PP 13.15, R1 13.84, and S1 12.59. Therefore, the 13.58–13.84 zone is a clear supply area.
Notably, Thursday’s candle ranged 12.45–13.70 and closed above the daily pivot at 13.15, indicating buyers defended the breakout zone. Volume was active into the close; follow-through interest is present, though durability still needs confirmation.
Intraday Setup for MARA (1H)
Meanwhile, the 1H chart confirms the constructive bias. Price is above the 20/50/200 EMAs at 13.00/12.73/11.51, so intraday trend alignment favors dips being absorbed.
The 1H RSI14 55.78 is positive but controlled. The 1H MACD histogram is 0.05, showing a building yet shallow impulse. 1H Bollinger bands center at 12.79 with an upper band at 13.68, leaving room to probe higher before bands stretch. The 1H pivot is 13.21 with R1 13.36; price hugging PP and just below minor resistance implies a nearby test.
15-Minute Execution Context
At the same time, the 15m setup shows a pause rather than a push. The 15m EMA20/50/200 print 13.21/13.05/12.64 with price at 13.28, so the micro-trend remains constructive.
However, the 15m RSI14 54.1 is only neutral-to-positive, and the 15m MACD histogram at -0.04 signals cooled short-term momentum. The 15m Bollinger mid is 13.35; price sits just below mid, reflecting consolidation. The 15m pivot grid places PP 13.23, R1 13.33, and S1 13.18, marking 13.18–13.23 as nearby support and 13.33–13.36 as the first cap.
News and Volatility Regime for Mara Holdings Stock
Additionally, recent news keeps volatility elevated. Q1 revenue $174.6 million versus $213.9 million a year prior shows sales softened year over year.
The company reported a $1.26 billion net loss, largely tied to a roughly $1.0 billion negative fair-value adjustment on Bitcoin. This accounting-driven loss elevates headline risk.
Meanwhile, MARA sold about $1.5 billion in BTC to fund debt reduction and the Long Ridge power asset for AI/HPC buildout. This strategic pivot changes the equity narrative and the cash flow profile. The stock fell about 6% on May 12 amid the pivot headlines, while one broker reiterated a $15 target. Opinions diverge, reinforcing two-way risk.
Bullish Scenario: Clearing 13.6–13.8 Resistance
Therefore, the bullish scenario hinges on clearing the nearby lid. A sustained move through the daily upper band at 13.58 and the daily R1 13.84 would confirm an upside breakout. Resistance taken out would validate trend continuation.
On indicators, keeping daily RSI anchored in the mid-to-high 60s and expanding the daily MACD histogram would help sustain the drive. Momentum follow-through would back price. Holding above the daily PP 13.15 would keep the setup orderly, as support retention signals control.
Bearish Scenario: Rejection and Mean Reversion Risks
On the other hand, the bearish scenario reasserts if price keeps rejecting the 13.6–13.8 zone and slips back through 13.15. A drop toward daily S1 12.59 and the 20-day EMA 12.00 would then be in play. Loss of short-term support hands the ball to sellers.
A cooling daily RSI and a flattening MACD histogram would confirm momentum fatigue, increasing pullback risk. Elevated ATR means downside moves could be abrupt; volatility cuts both ways.
Bottom Line: Cautiously Bullish into 13.6–13.8 for Mara Holdings Stock
In contrast to the clean daily and 1H alignment, the 15m softness warns of near-term chop before any next leg. Overall, the bias is cautiously bullish into 13.6–13.8, but news-driven uncertainty around the AI pivot and Bitcoin sensitivity keeps the path uneven. Positioning should respect the wide daily ATR and the tight intraday pivot bands.