



AMC Entertainment Holdings, Inc stock heads into its Q2 2026 earnings in a state of measured indecision. Trading at $1.92 as of July 17, price sits just below the daily EMA20 with no decisive directional commitment. The technical picture reads neutral across timeframes. Yet a quiet tension builds between improving fundamentals and persistent price weakness ahead of Monday’s print.
Key takeaways
- AMC closed at $1.94 on July 17, failing to hold the psychologically significant $2.00 level.
- Daily EMA50 at $1.88 and EMA200 at $1.89 provide a structural support floor clustered just below current price.
- Texas Capital upgraded AMC, citing debt refinancing progress ahead of the Q2 earnings release.
- The daily ATR14 of $0.16 signals moderate volatility — enough for meaningful post-earnings swings.
- A clean break below the $1.88 zone would invalidate the bullish setup entirely.
Daily Timeframe Sets the Tone: Neutral With a Soft Bearish Lean
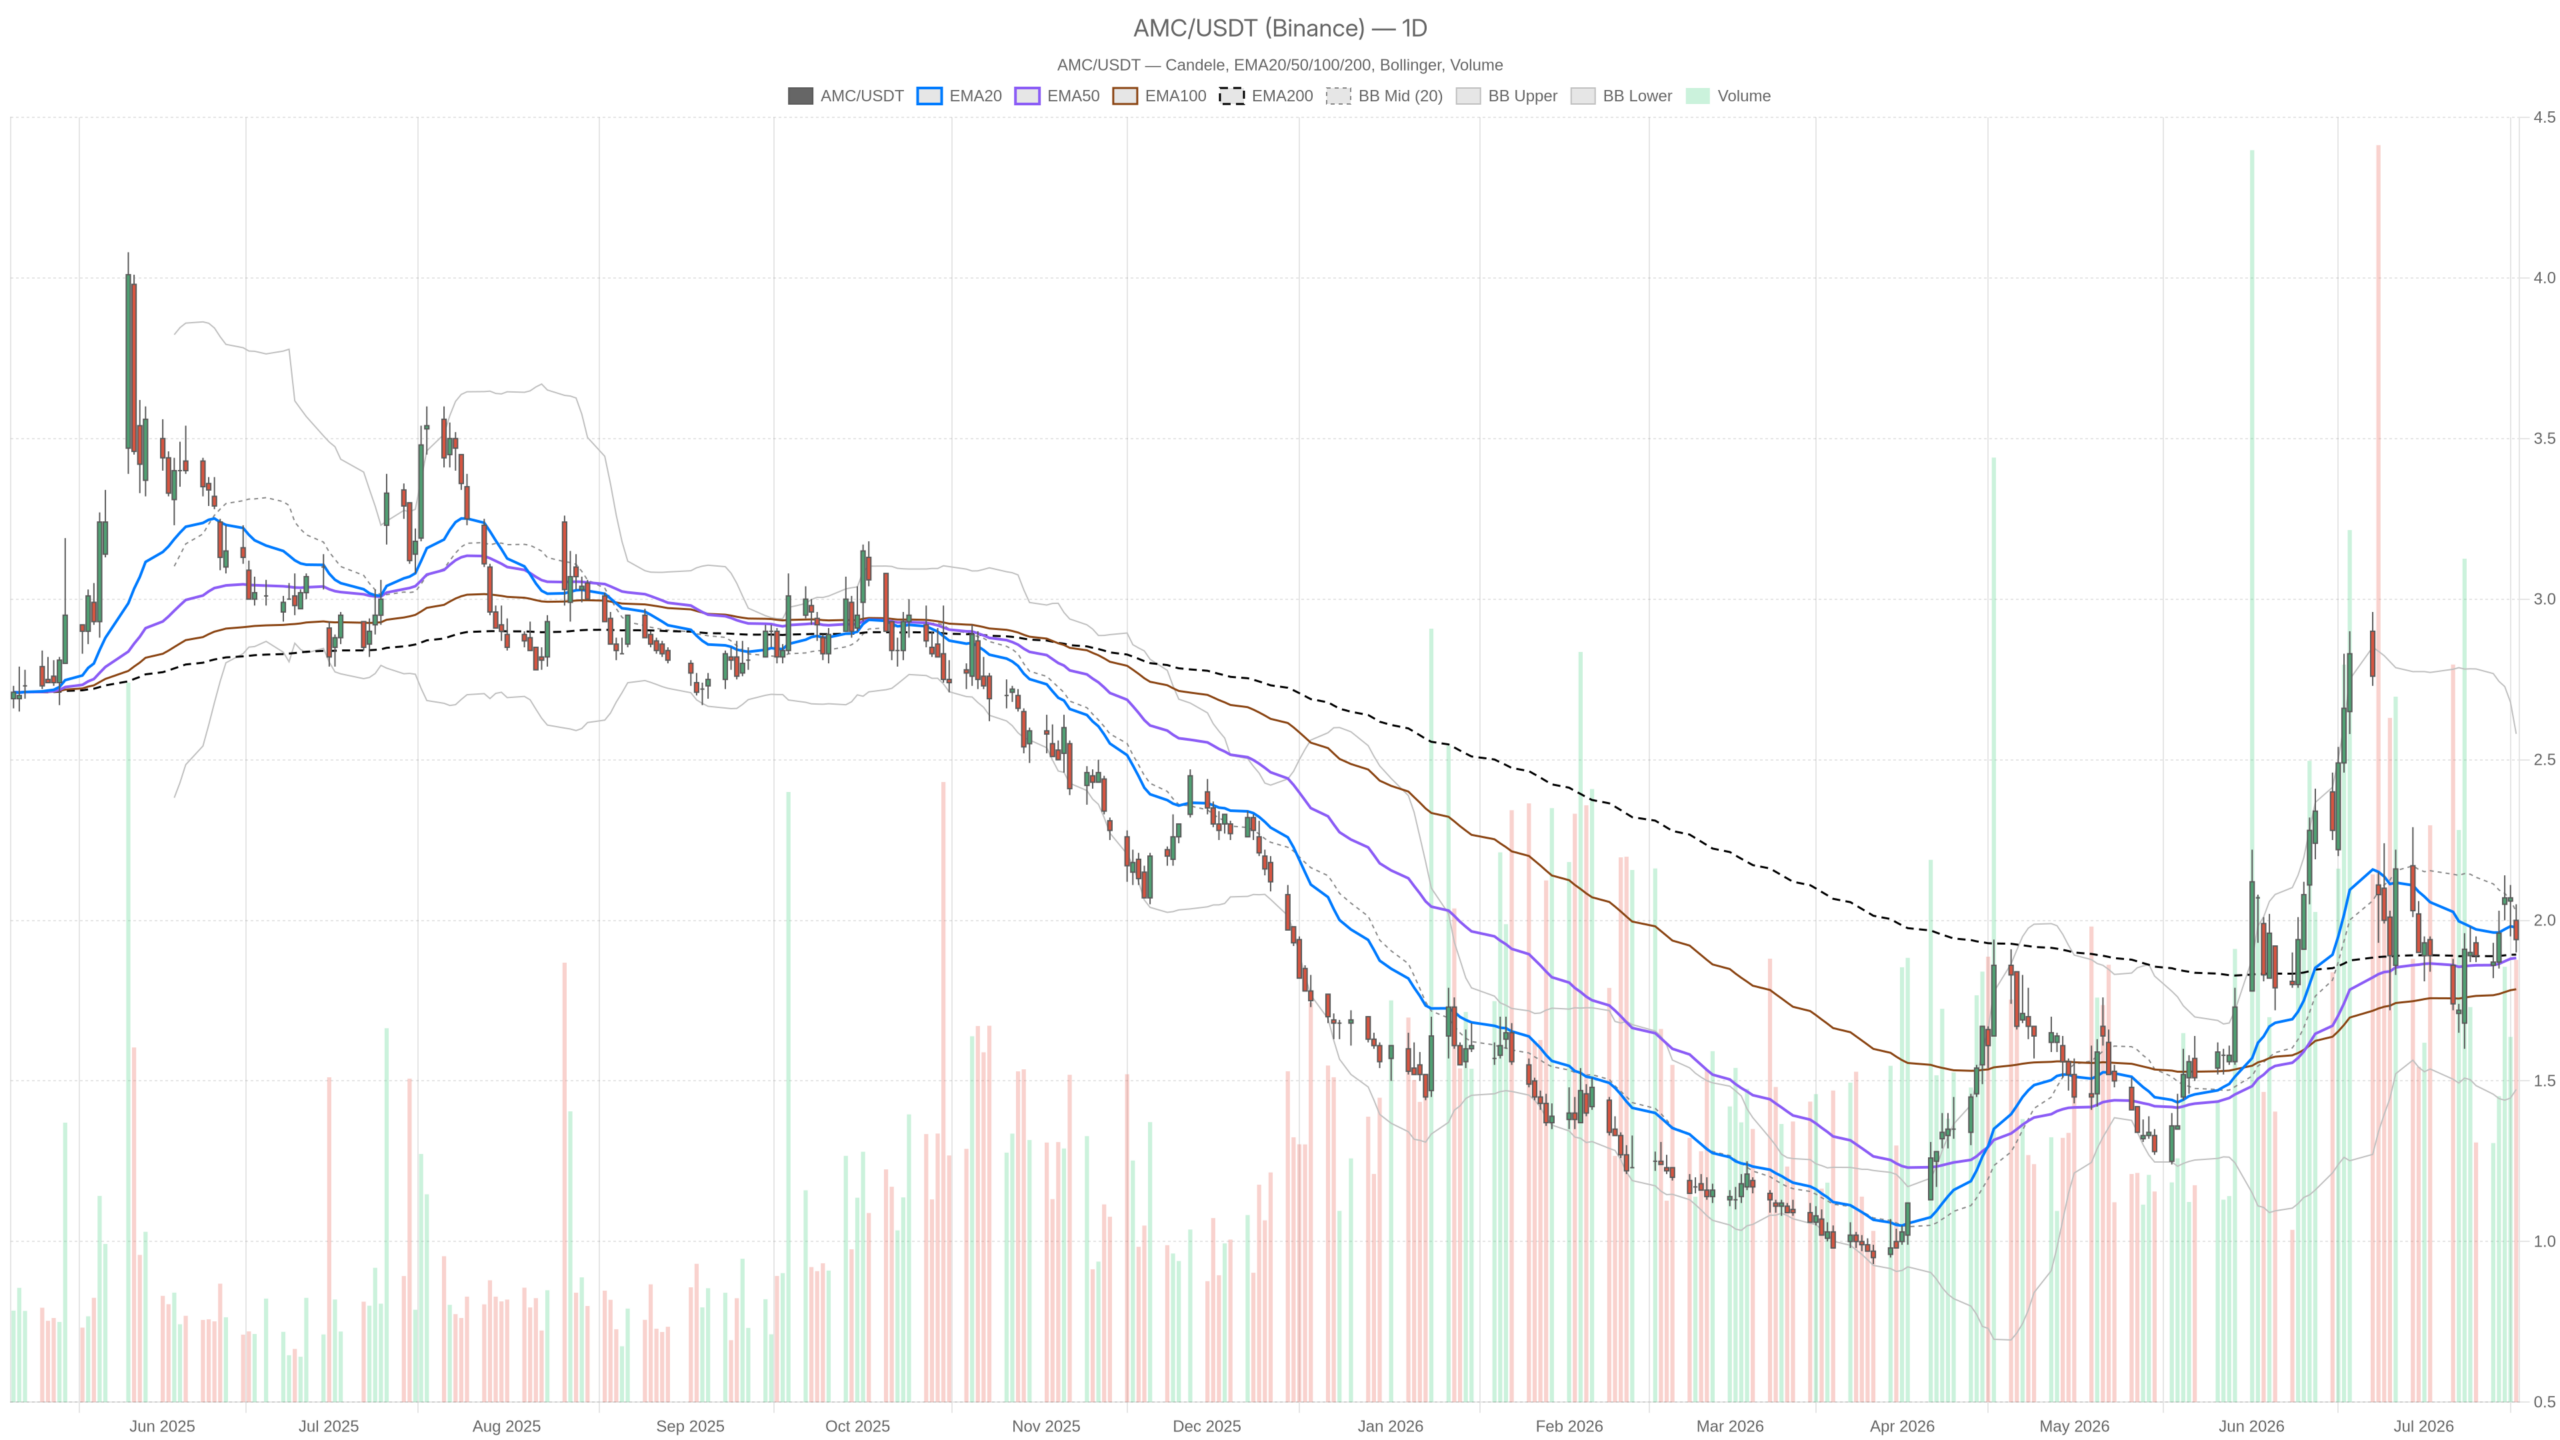
AMC’s daily chart defines a neutral but cautiously mixed bias heading into earnings. Price closed at $1.94 on July 17. It opened at $2.00 and touched an intraday high of $2.05 before fading back below the psychologically important $2.00 level. The EMA20 sits at $1.98, with price now trading beneath it — a mild but meaningful signal of short-term softness.
However, the longer-term moving averages tell a more constructive story. The EMA50 at $1.88 and EMA200 at $1.89 are clustered just below current price. That proximity provides a structural floor. The stock has not collapsed through those levels, which limits the downside narrative for now.
Meanwhile, the daily RSI at 48.98 is essentially mid-range. It reflects neither buying pressure nor genuine distribution — just drift. The MACD tells a similar story: the line sits at 0, with the signal at 0.01. A histogram reading of -0.01 confirms the absence of upside momentum at the daily level.
Bollinger Bands and Pivot Context
Bollinger Band positioning reinforces this neutral read. The midline is at $2.03, the upper band at $2.58, and the lower band at $1.47. Price sits in the lower half of the range, drifting toward the midline without conviction. The ATR14 of $0.16 indicates moderate daily volatility — enough to produce meaningful swings around an earnings catalyst.
Overall, pivot analysis places the daily pivot point at $1.96. R1 sits at $2.03 and S1 at $1.88. Price has already failed to hold above the pivot. That puts the first real demand area at $1.88, where the EMA50 and EMA200 converge — a technically significant zone.
Hourly Chart Weakens the Case for Bulls
The hourly timeframe tilts more bearish, with price trading below its near-term moving average cloud. Price closed the last hourly candle at $1.92. All three EMAs — at $1.97, $1.95, and $1.95 — sit above current price. That stacked configuration indicates short-term bearish pressure, weighing against any immediate recovery.
Still, the hourly RSI at 43.34 tilts toward oversold territory without actually entering it. This suggests fading momentum rather than a clean reversal setup. The MACD on this timeframe mirrors the daily — marginally negative histogram, no recovery signal yet.
Meanwhile, the 1H Bollinger Bands are notably tighter than on the daily. The upper band sits at $2.09, the lower at $1.91, and the midline at $2.00. Price is pressing the lower band. That compression can precede a bounce, but it can also precede a breakdown.
Given the lack of RSI or MACD upside confirmation, caution is warranted. The 1H pivot sits at $1.92, with R1 at $1.94 and S1 at $1.90. The range is tight and the stock is coiling ahead of the catalyst.
15-Minute Execution Context: Short-Term Pressure Is Real
Short-term selling pressure is real, with the 15-minute RSI approaching oversold at 36.92. The MACD line at -0.02 sits below the signal at -0.01. On this timeframe, the EMA50 at $1.97 stands above both the EMA20 at $1.95 and EMA200 at $1.94 — a bearish short-term configuration.
In contrast to the daily, which provides structural support from the EMA cluster, the 15-minute chart shows active selling pressure in the near term. Volatility on this granularity is low, with ATR14 at just $0.03. That tight range is consistent with a stock waiting, not trending. Traders should note that $1.90 appears as S1 on both the 1H and 15m pivot grids, making it a concrete near-term line to monitor.
AMC Entertainment Holdings, Inc Stock: Fundamental Catalysts Complicate the Technical Narrative
Fundamental catalysts complicate the neutral technical picture, with debt refinancing progress offering a genuine tailwind. Texas Capital upgraded AMC Entertainment stock rating, citing progress on the company’s debt refinancing. That upgrade, alongside reports of a positive Earnings ESP and stronger box-office momentum heading into summer, provides a backdrop more supportive than the chart alone implies.
Nevertheless, recent debt refinancing improving financial flexibility is a genuinely significant development. It does not make AMC a clean fundamental buy, but it does reduce tail risk heading into the print. The question the market will answer on Monday is whether a blockbuster summer translated into meaningful loss reduction in Q2.
Bullish Scenario: Earnings Catalyst Unlocks the Path to $2.05 and Beyond
The bullish case for AMC Entertainment Holdings, Inc stock hinges on a Q2 earnings beat driving price back above the daily Bollinger midline. A strong print demonstrating narrowing losses on the back of summer box-office momentum could quickly change the technical picture. The EMA50 and EMA200 clustering near $1.88–$1.89 means the stock has not broken down structurally.
A reversal from these levels, combined with a positive earnings surprise, could propel price back above the daily EMA20 at $1.98. From there, a move toward the intraday high of $2.05 becomes plausible. Notably, a sustained reclaim of $2.03 — the daily Bollinger midline — would signal a meaningful shift in sentiment. Above that level, the stock would trade in the upper half of its Bollinger range, validating a more constructive bias.
Bearish Scenario: Disappointing Results Could Test $1.88 Support
A disappointing earnings report would likely confirm the current drift lower, testing the $1.88 support confluence. Price is already below the daily pivot at $1.96 and beneath all key EMAs on the 1H chart. A negative earnings reaction could push AMC toward $1.88 — the convergence of the EMA50, EMA200, and daily S1. A clean break below that zone would invalidate the bullish setup entirely.
Furthermore, the 15-minute RSI approaching oversold does not guarantee a bounce if the fundamental trigger turns negative. Pre-earnings price compression can unwind violently in either direction. AMC’s historically high retail investor activity adds unpredictability to the volatility profile.
Positioning Into the Print: Volatility and Uncertainty Define the Setup
AMC Entertainment Holdings, Inc stock trades in a narrow, technically fragile range just ahead of a binary catalyst. The daily regime is neutral. The hourly confirms weak short-term momentum. The 15-minute shows incremental selling pressure. None of this should be mistaken for structural collapse — the EMA cluster near $1.88–$1.89 continues to act as a meaningful floor.
At the same time, the convergence of Texas Capital’s upgrade, debt refinancing progress, and improved box-office momentum gives the stock a real fundamental argument heading into Monday. The technical setup is not confirming that optimism yet. With ATR14 at $0.16 on the daily, even a modest earnings-driven move could be significant relative to the current price. Disciplined traders will want to let the earnings reaction define the next directional leg before committing.
FAQ
When does AMC report Q2 2026 earnings?
AMC reports Q2 2026 earnings on Monday, July 20, before the market opens.
What are the key support levels for AMC Entertainment Holdings, Inc stock?
The critical support is at $1.88, where the daily EMA50, EMA200, and S1 pivot all converge. A break below this zone would invalidate the bullish case.
What is the current analyst sentiment on AMC?
Texas Capital recently upgraded AMC Entertainment stock, citing progress on debt refinancing and improved financial flexibility heading into summer.
What is the bullish scenario for AMC stock?
A strong Q2 earnings beat could propel price back above the daily EMA20 at $1.98 and toward the $2.03 Bollinger midline. Sustained trade above that level would signal a meaningful shift in sentiment.
Disclaimer: This article is for informational purposes only and does not constitute financial advice, an investment recommendation, or a solicitation to buy or sell any financial instrument or cryptocurrency. The analysis provided is not indicative of future results. Investing in crypto assets and financial markets carries a high risk of capital loss. Always do your own research (DYOR) and consult a qualified financial advisor before making any decision.
Article produced with the assistance of artificial intelligence and reviewed by the editorial team.