



Ambarella, Inc. Stock Breaks Out as M&A Catalyst Meets Bullish Structure
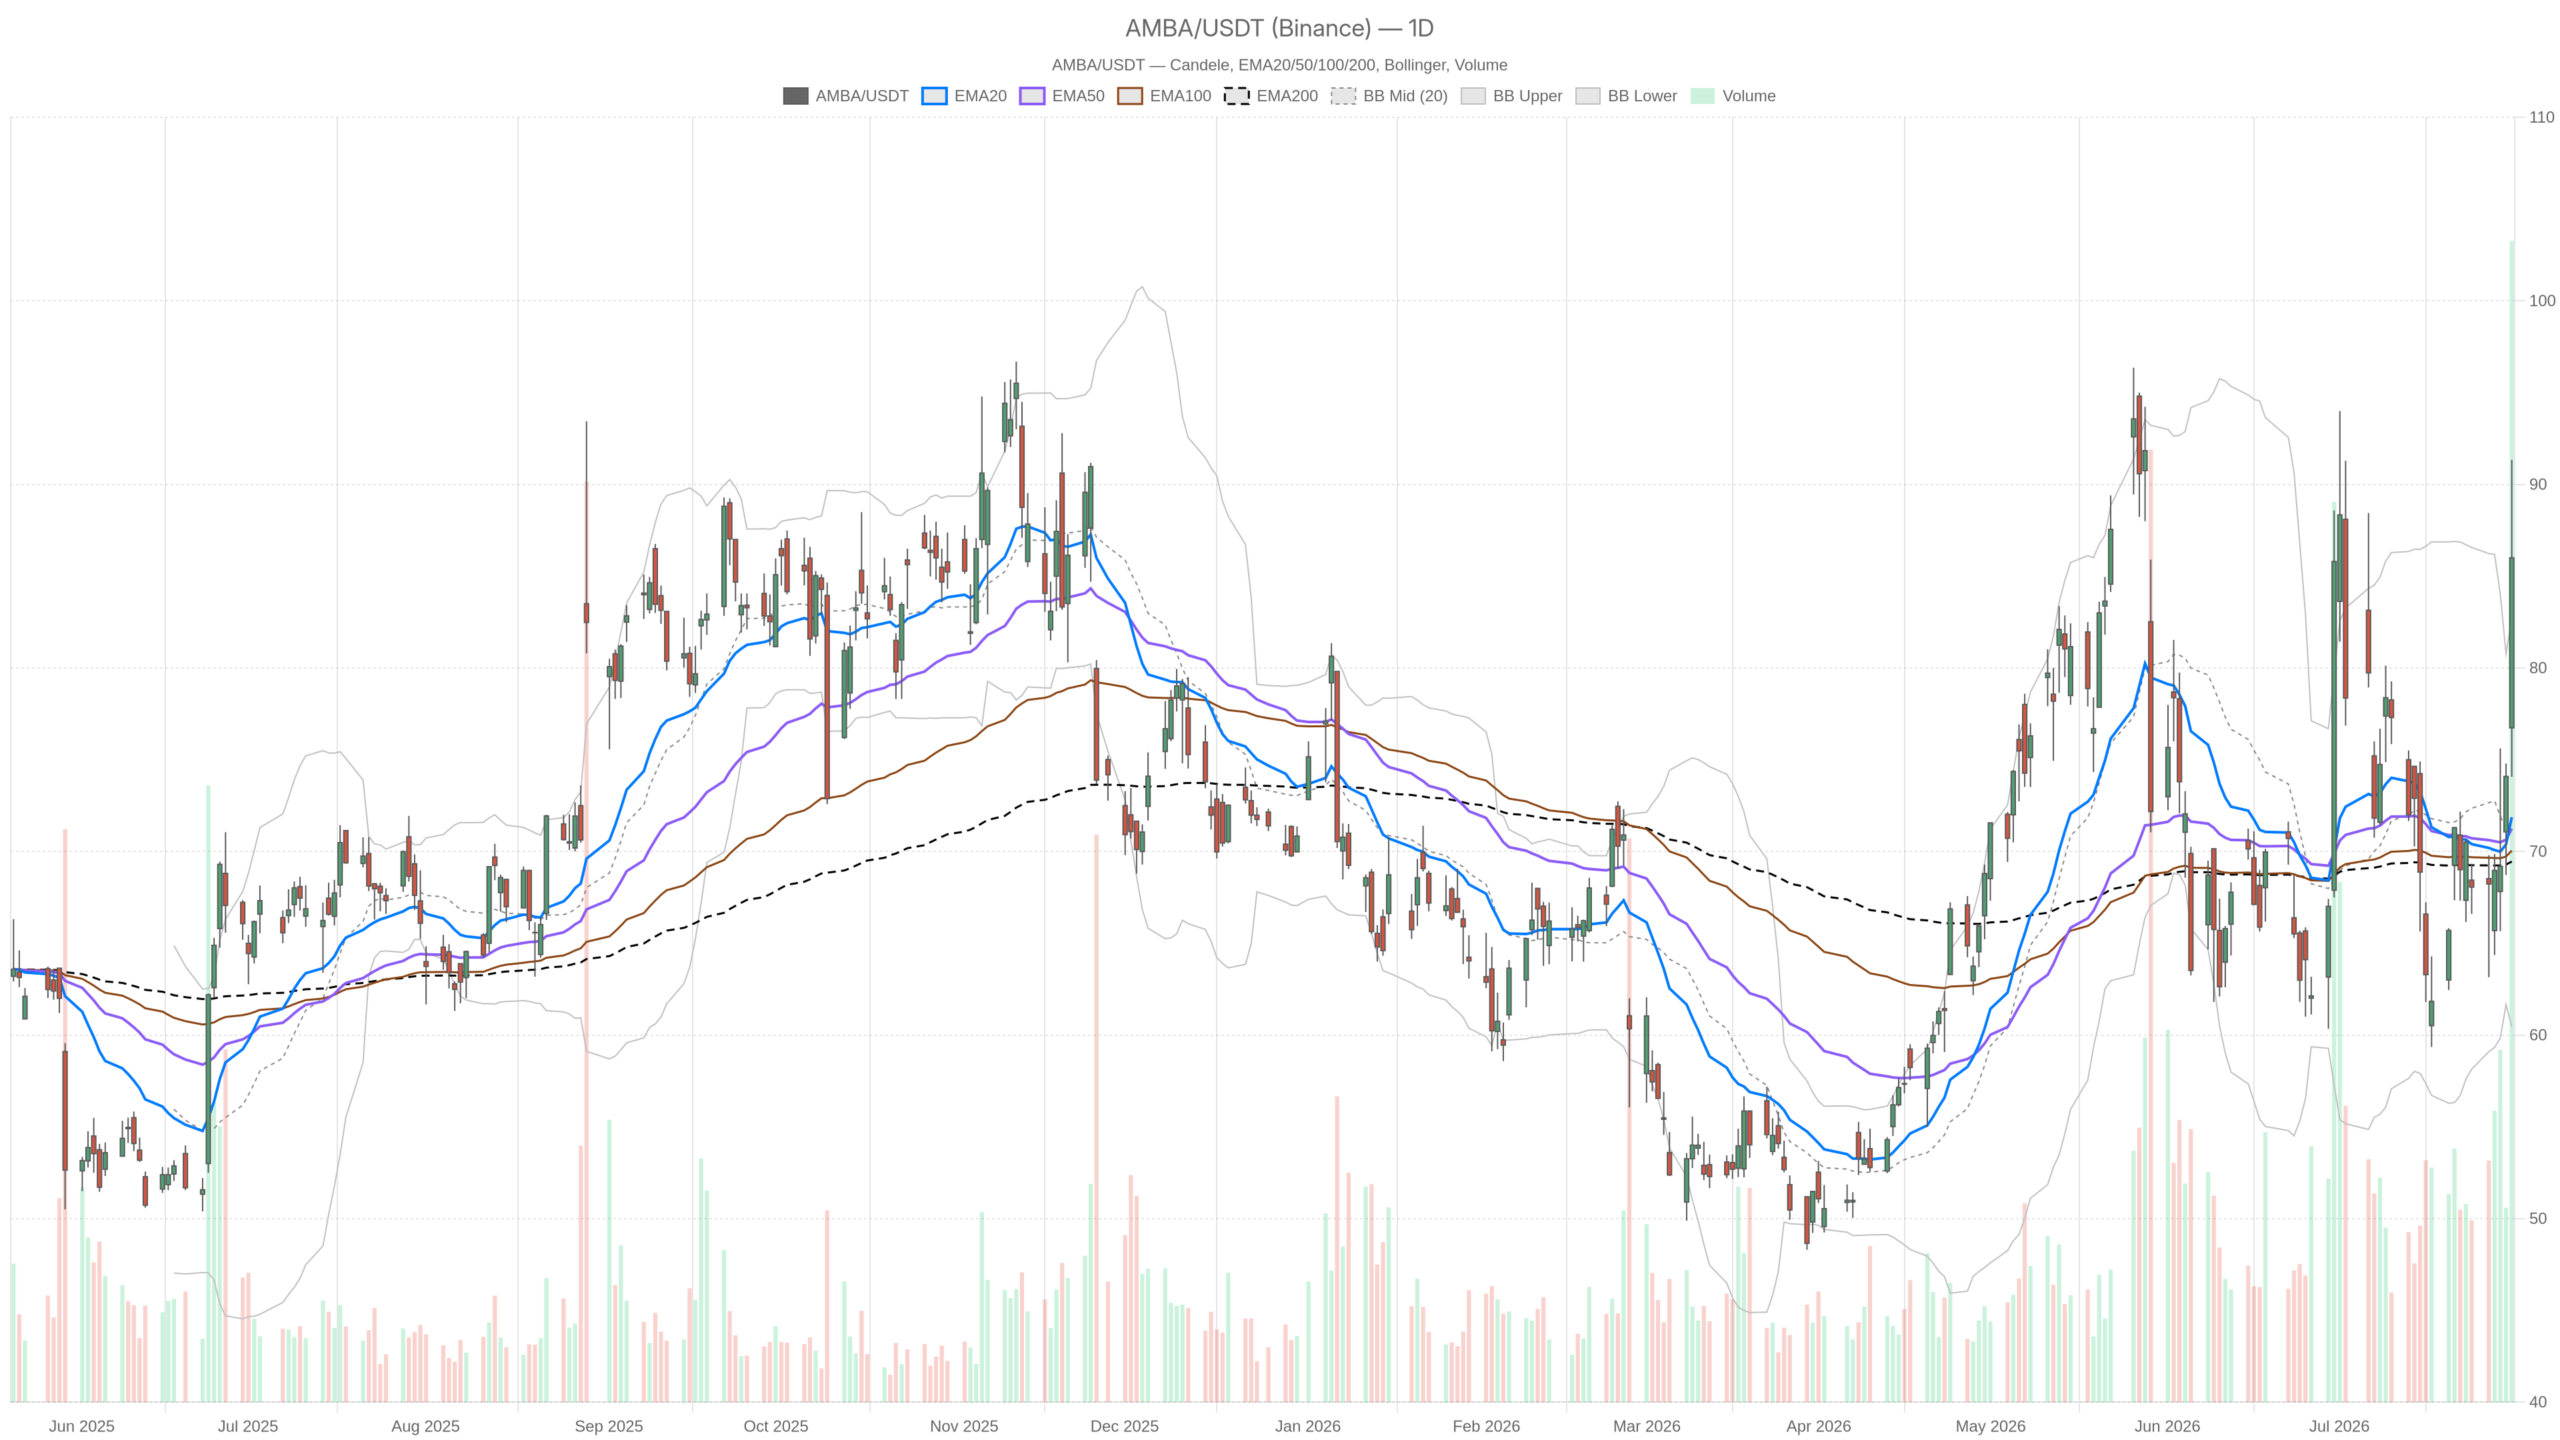
Ambarella, Inc. stock surged decisively on July 31, closing at $86.00 after hitting an intraday high of $91.34. Reports of acquisition talks with NXP Semiconductors sparked the move on heavy volume exceeding 9 million shares. The technical structure, already constructive, now aligns with a powerful narrative.
Key takeaways
- Ambarella, Inc. stock closed at $86.00 on July 31, fueled by reports of acquisition talks with NXP Semiconductors.
- Daily EMAs are stacked bullishly — EMA20 at $71.87, EMA50 at $71.25, and EMA200 at $69.45 — confirming broad trend participation.
- The daily RSI at 64.54 confirms momentum without triggering overbought conditions, while the MACD crossover signals a meaningful shift.
- The 1H RSI at 74.55 is in overbought territory, suggesting the intraday move may need consolidation before further upside.
- A daily close below $76.27 would invalidate the bullish breakout and point to a retracement toward pre-spike levels near $74–$76.
Daily Timeframe: Is Ambarella, Inc. Stock in a Bullish Regime?
Yes. The daily chart confirms a clean bullish regime for Ambarella, Inc. stock, with momentum building well before Thursday’s surge. All three key exponential moving averages sit stacked in bullish order beneath the price.
Notably, the EMA20 at $71.87, EMA50 at $71.25, and EMA200 at $69.45 all sit below the close. That alignment signals broad trend participation, not a one-day anomaly.
Momentum and Oscillator Readings
Meanwhile, the daily RSI stands at 64.54 — elevated but not yet overbought. It confirms momentum without flashing an immediate exhaustion warning. The MACD histogram has turned sharply positive at 1.26. The MACD line at 0.75 crossed above its signal line at -0.51. That crossover on the daily timeframe marks a meaningful momentum shift.
Bollinger Bands and Volatility Context
The daily close at $86.00 punched well above the upper Bollinger Band at $82.74. Such extensions can reflect a genuine breakout or a volatility spike that reverts. Given the M&A backdrop, a sustained hold above the upper band is plausible. However, it warrants close watching over the next several sessions.
At the same time, the daily ATR of $6.71 illustrates how volatile Ambarella, Inc. stock has become. At current price levels, that translates to meaningful daily swings. The daily pivot sits at $83.80, with resistance at $93.54 and support at $76.27. A retest of $83.80–$82.74 would be a natural area for buyers to re-engage on any pullback.
Hourly Confirmation: Does the 1H Chart Support the Breakout?
Yes, but with a notable caveat. The 1-hour chart fully aligns with the daily bullish regime. However, the 1H RSI has climbed to 74.55, placing it firmly in overbought territory. That doesn’t mean the rally is over. But it suggests the intraday move may need to consolidate before the next leg higher.
Meanwhile, the 1H MACD supports the upward thrust, with a histogram of 1.44 and the line at 4.38 well above its signal at 2.94. All three 1H EMAs — at $76.85, $72.51, and $71.15 — sit far below the current price. This confirms the trend is intact and the move is impulsive in nature.
However, the 1H Bollinger upper band sits at $87.70. Price closed at $85.98 on the final hour, just below that band ceiling. This proximity suggests the stock is pressing against short-term resistance. The 1H pivot cluster at $86.19 (PP), $86.94 (R1), and $85.23 (S1) defines a tight range of immediate interest. In short, the hourly setup confirms the breakout but signals limited upside room on the initial spike.
15-Minute Chart: Is Intraday Fatigue Emerging for Ambarella, Inc. Stock?
The 15-minute chart introduces the first sign of short-term cooling for Ambarella, Inc. stock. The MACD histogram has dipped to -0.22, with the line at 3.02 slipping just below its signal at 3.24. That’s a minor negative cross — not a reversal signal, but a caution flag for immediate entries.
In contrast, the 15m RSI at 63.61 is more neutral. This suggests the extreme overbought pressure seen on the 1H has partially unwound at the micro level. Price is consolidating between $85.44 and $86.93, broadly consistent with the 1H pivot range. Therefore, the 15-minute chart is best read as a consolidation zone following an impulsive spike — not a breakdown in structure.
Bullish Scenario: Can the M&A Premium Sustain Ambarella, Inc. Stock?
The fundamental driver is unambiguous. Reports of a potential acquisition by NXP Semiconductors represent a premium event that fundamentally reprices Ambarella, Inc. stock. If those talks progress, the market will continuously re-rate AMBA toward a deal value likely above current levels.
Meanwhile, Stifel reiterated its Buy rating earlier in the week, citing Ambarella’s chip roadmap. That adds analyst conviction as a secondary layer of support. On the technical side, a bull continuation would see AMBA hold above the daily pivot at $83.80. It would regroup near the Bollinger midline area on any short-term pullback.
Therefore, a reclaim of $87–$88 on the 1H with declining RSI would reset overbought conditions. That would open the path toward the daily R1 at $93.54. This level represents the next meaningful technical target if deal momentum builds.
Bearish Scenario: What Invalidates the Bullish Case for Ambarella, Inc. Stock?
Acquisition talks are notoriously fragile. A denial, a leak of deal collapse, or a lack of follow-through from NXP would strip away the premium almost instantly. In that scenario, a sharp gap-fill toward pre-spike levels near $74–$76 becomes credible.
Technically, a daily close below $76.27 — the daily S1 — would signal that the breakout has failed. The move would then appear purely event-driven with no structural follow-through. Furthermore, the 1H RSI at 74.55 leaves little room for error on the upside. If buying pressure doesn’t resume promptly, mean reversion on the hourly could accelerate. The 15m MACD’s early negative cross would, in that context, have been the first warning of a broader intraday rollover.
Positioning and Volatility Outlook for Ambarella, Inc. Stock
Overall, Ambarella, Inc. stock sits in a technically sound bullish regime reinforced by a live M&A catalyst — a rare combination. The daily structure is clean, the trend is aligned, and the fundamental news is significant. At the same time, the stock is extended, volatility is elevated with an ATR above $6, and the 1H RSI is in overbought territory.
That combination demands disciplined risk management. The $83.80–$82.74 range represents the first meaningful support zone on any retracement. Conviction on the bullish side must remain conditional on deal reports being substantiated. Until then, the price action is a powerful signal — but one operating in an environment of material uncertainty.
FAQ
Why did Ambarella, Inc. stock surge on July 31?
Ambarella, Inc. stock surged after reports emerged that the company is in acquisition talks with NXP Semiconductors. The stock closed at $86.00 with an intraday high of $91.34 on volume exceeding 9 million shares.
Is Ambarella, Inc. stock overbought after the rally?
On the 1-hour timeframe, the RSI reached 74.55, which is in overbought territory. However, the daily RSI at 64.54 remains elevated but not overbought, suggesting room for further upside after potential consolidation.
What are the key support and resistance levels for AMBA?
Key support sits at the daily pivot of $83.80 and the Bollinger upper band area at $82.74. The daily S1 at $76.27 represents a critical level — a close below it would invalidate the bullish breakout. The next meaningful resistance target is the daily R1 at $93.54.
What could cause Ambarella, Inc. stock to decline sharply?
A denial of acquisition talks, a leak of deal collapse, or lack of follow-through from NXP Semiconductors would likely strip away the M&A premium. In that scenario, AMBA could gap-fill toward pre-spike levels near $74–$76.
Disclaimer: This article is for informational purposes only and does not constitute financial advice, an investment recommendation, or a solicitation to buy or sell any financial instrument or cryptocurrency. The analysis provided is not indicative of future results. Investing in crypto assets and financial markets carries a high risk of capital loss. Always do your own research (DYOR) and consult a qualified financial advisor before making any decision.
Article produced with the assistance of artificial intelligence and reviewed by the editorial team.