



SoFi Technologies, Inc. stock surged post-earnings, closing at $18.02 on August 3. The session spanned a wide $16.45–$18.08 range on 75.7 million shares. This volatile action signals an active battle for control following the second-quarter report, with the stock now testing key resistance.
Key takeaways
- SoFi delivered 40.5% year-over-year revenue growth to $1.21 billion, with non-GAAP EPS of $0.12 beating consensus by 9.9%
- The daily trend remains neutral despite the rebound, with RSI at 55.57 and MACD still technically negative
- Hourly RSI has reached overbought territory at 74, creating a clear timeframe divergence against the still-neutral daily chart
- The critical resistance zone sits between $17.88 and $18.13 on shorter timeframes, with daily R1 at $18.59 marking the next upside hurdle
- A daily close below the EMA20 at $17.10 would invalidate the bullish recovery thesis
SoFi Technologies, Inc. Stock: Why the Fundamentals Support the Rebound
SoFi Technologies, Inc. stock delivered 40.5% year-over-year revenue growth and beat estimates by 9.9%. Yet the shares initially dropped after the print. That disconnect between strong numbers and negative price action now fuels the rebound.
Revenue grew to $1.21 billion, with non-GAAP profit of $0.12 per share landing above consensus. According to Motley Fool coverage, the stock still declined immediately after the release. Shay Boloor, chief market strategist at Futrum Equities, argued the market is overpricing SoFi’s credit risk. Meanwhile, he noted it is underpricing the expanding platform, where each new member turns into multiple financial relationships. Separately, a Seeking Alpha piece rated the stock a Strong Buy, pointing to 41% year-over-year revenue growth and record loan originations. Overall, the fundamental narrative is bullish. However, price-target cuts from some analysts signal the Street is not fully convinced yet.
SoFi Technologies, Inc. Stock Daily Trend: Neutral but Improving
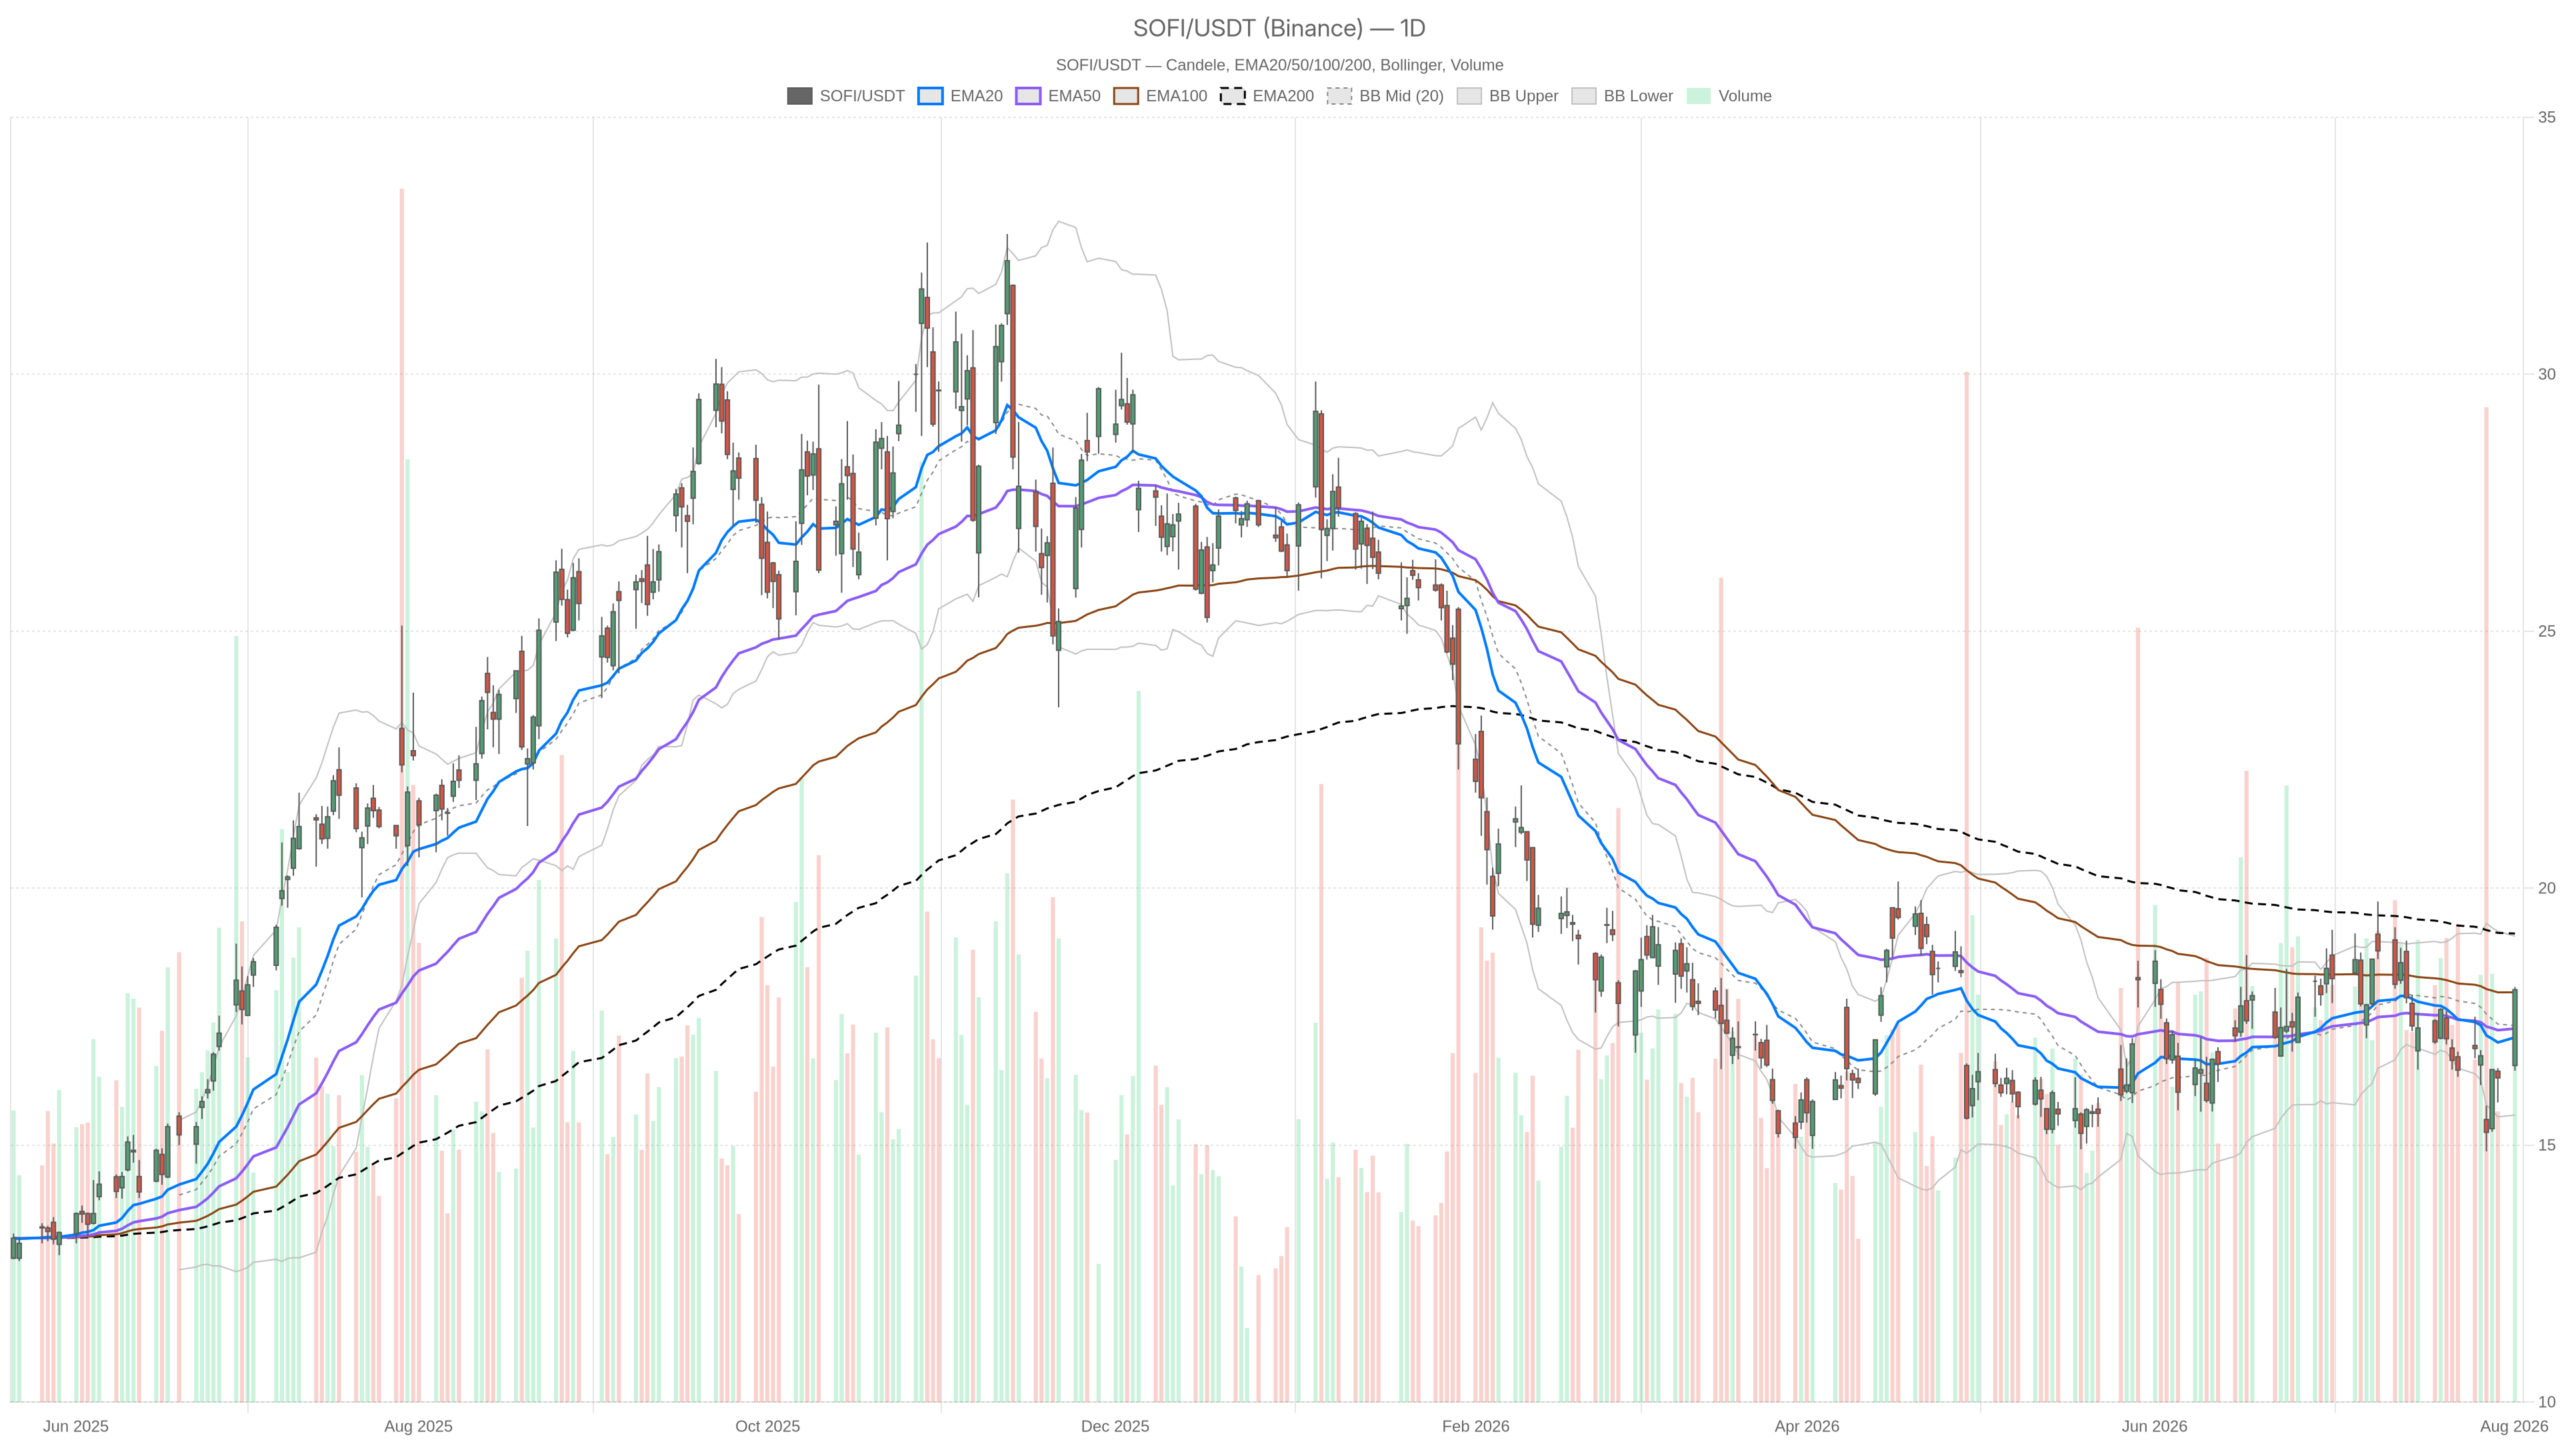
SoFi Technologies, Inc. stock is showing constructive short-term signals on the daily chart. However, the broader trend remains neutral and capped by the EMA200 at $19.12.
Price is trading above its EMA20 at 17.10 and EMA50 at 17.27. That is a constructive short-term signal. However, the EMA200 sits far higher at 19.12. This means the broader daily trend remains capped by a longer-term ceiling not yet tested. RSI14 at 55.57 is neutral, not overbought. That leaves room for the rally to extend without an immediate exhaustion signal.
MACD tells a more cautious story: the line sits at -0.22 against a signal of -0.18. The histogram reads -0.04. That is still technically bearish, though the narrowing gap suggests momentum is catching up but has not confirmed a turn. Bollinger Bands show price pushing toward the upper band at 19.07, with the mid-band at 17.33. ATR14 at 0.94 is elevated, so continued large daily swings should be expected. On pivots, price trades above the daily pivot of 17.52 and tests the path toward R1 at $18.59. S1 at 16.96 marks the nearest downside reference.
Hourly Momentum on SoFi Stock Confirms Strength but Runs Hot
The hourly chart on SoFi stock paints a cleaner bullish picture with all moving averages stacked favorably. However, overbought RSI at 74 warns of near-term vulnerability.
EMA20 at 16.96, EMA50 at 16.73, and EMA200 at 17.21 all sit below the current price. This is a clean bullish stack intraday. MACD on this timeframe is firmly positive. The line reads 0.44 against a signal of 0.25, with a histogram of 0.19. That represents solid bullish momentum. At the same time, RSI14 has climbed to 74, which is clearly overbought. So while the hourly trend is intact, the stock is vulnerable to short bursts of consolidation. A pullback may be needed simply to relieve that stretched reading.
Bollinger Bands show price near the upper band at 18.18, with the mid-band at 16.73. On pivots, price sits between the hourly pivot of 17.98 and R1 at 18.13. In effect, it is knocking on the door of resistance.
Here is the conflict worth flagging: the daily chart is still neutral, with RSI near 55 and MACD technically negative. In contrast, the hourly chart is overbought and strongly bullish. That divergence means the near-term push is running hot. Meanwhile, the bigger daily picture has not fully caught up. This is not a clean, aligned setup across timeframes, and traders should treat it as such.
15-Minute Execution: SoFi Stock Stretched Right at Resistance
The 15-minute chart confirms the bullish EMA stack but reveals dangerously stretched momentum. RSI sits at 79.91 and an early MACD warning signal has appeared.
The EMA stack remains bullish. EMA20 at 17.67 sits above EMA50 at 17.15, which sits above EMA200 at 16.67. However, RSI14 at 79.91 is extremely stretched. Notably, the MACD histogram has just turned slightly negative at -0.02. This has happened even though the line technically remains above the signal. That is an early warning of momentum stalling right into resistance. Bollinger Bands show price near the upper band at 18.10. The pivot cluster at 17.99 to 18.12 is essentially where price hovers right now. For execution purposes, this zone is the immediate battleground.
Bullish and Bearish Scenarios for SoFi Technologies, Inc. Stock
SoFi Technologies, Inc. stock now faces two diverging paths: a bullish breakout above $18.59 or a bearish rejection back toward the daily pivot at $17.52.
For the bullish case to build real conviction, price needs to clear and hold above daily R1 at 18.59. That would open a path toward the confluence of the EMA200 at 19.12 and the upper Bollinger Band at 19.07. Support from the fundamental story—member growth, product expansion, and record loan originations—could help buyers push through the current overbought readings. A daily MACD crossover back above its signal line would provide the technical confirmation bulls need. That would finally align the daily structure with the hourly bullish setup.
On the other hand, the bearish scenario centers on rejection at the current resistance band. This spans roughly 17.88 to 18.13 on the hourly chart and 17.90 to 18.12 on the 15-minute chart. If RSI fades on these shorter timeframes without price breaking higher, a pullback becomes the more likely path. The first stop would be the daily pivot at 17.52. The next would be S1 at 16.96. Price-target cuts that followed earnings show some analysts remain skeptical despite the beat. If the EMA200 on the daily continues to act as a hard ceiling, that would reinforce the bearish case. The bullish thesis would be invalidated by a daily close back below the EMA20 at $17.10. That would signal the recovery attempt has failed.
Overall, SoFi Technologies, Inc. stock sits at an inflection point. Strong quarterly results and constructive short-term price action are colliding with overbought intraday momentum and a still-neutral daily trend. Positioning here requires patience given the elevated ATR and the wide range already seen this week. Therefore, volatility should remain a defining feature in the sessions ahead. The uncertainty around whether the daily chart confirms or rejects this rebound leaves the near-term path genuinely open.
FAQ
Why did SoFi Technologies, Inc. stock drop initially after strong earnings?
The stock dropped despite revenue growing 40.5% year over year to $1.21 billion and non-GAAP EPS of $0.12 beating consensus by 9.9%. Some analysts issued price-target cuts, signaling lingering skepticism about credit risk even as the platform expands.
What are the key resistance levels for SoFi stock?
The immediate resistance zone spans $17.88 to $18.13 on shorter timeframes, with daily R1 at $18.59 marking the next major hurdle. Above that, the EMA200 at $19.12 and the upper Bollinger Band at $19.07 form a critical confluence.
Is SoFi stock overbought after the post-earnings rebound?
On the hourly chart, RSI has reached 74 and the 15-minute RSI is at 79.91, both in overbought territory. However, the daily RSI at 55.57 remains neutral, meaning the overbought condition is limited to shorter timeframes.
What would invalidate the bullish case for SoFi Technologies, Inc. stock?
A daily close below the EMA20 at $17.10 would signal the recovery attempt has failed and invalidate the bullish thesis. This would likely open a path toward the daily S1 level at $16.96.
Disclaimer: This article is for informational purposes only and does not constitute financial advice, an investment recommendation, or a solicitation to buy or sell any financial instrument or cryptocurrency. The analysis provided is not indicative of future results. Investing in crypto assets and financial markets carries a high risk of capital loss. Always do your own research (DYOR) and consult a qualified financial advisor before making any decision.
Article produced with the assistance of artificial intelligence and reviewed by the editorial team.