



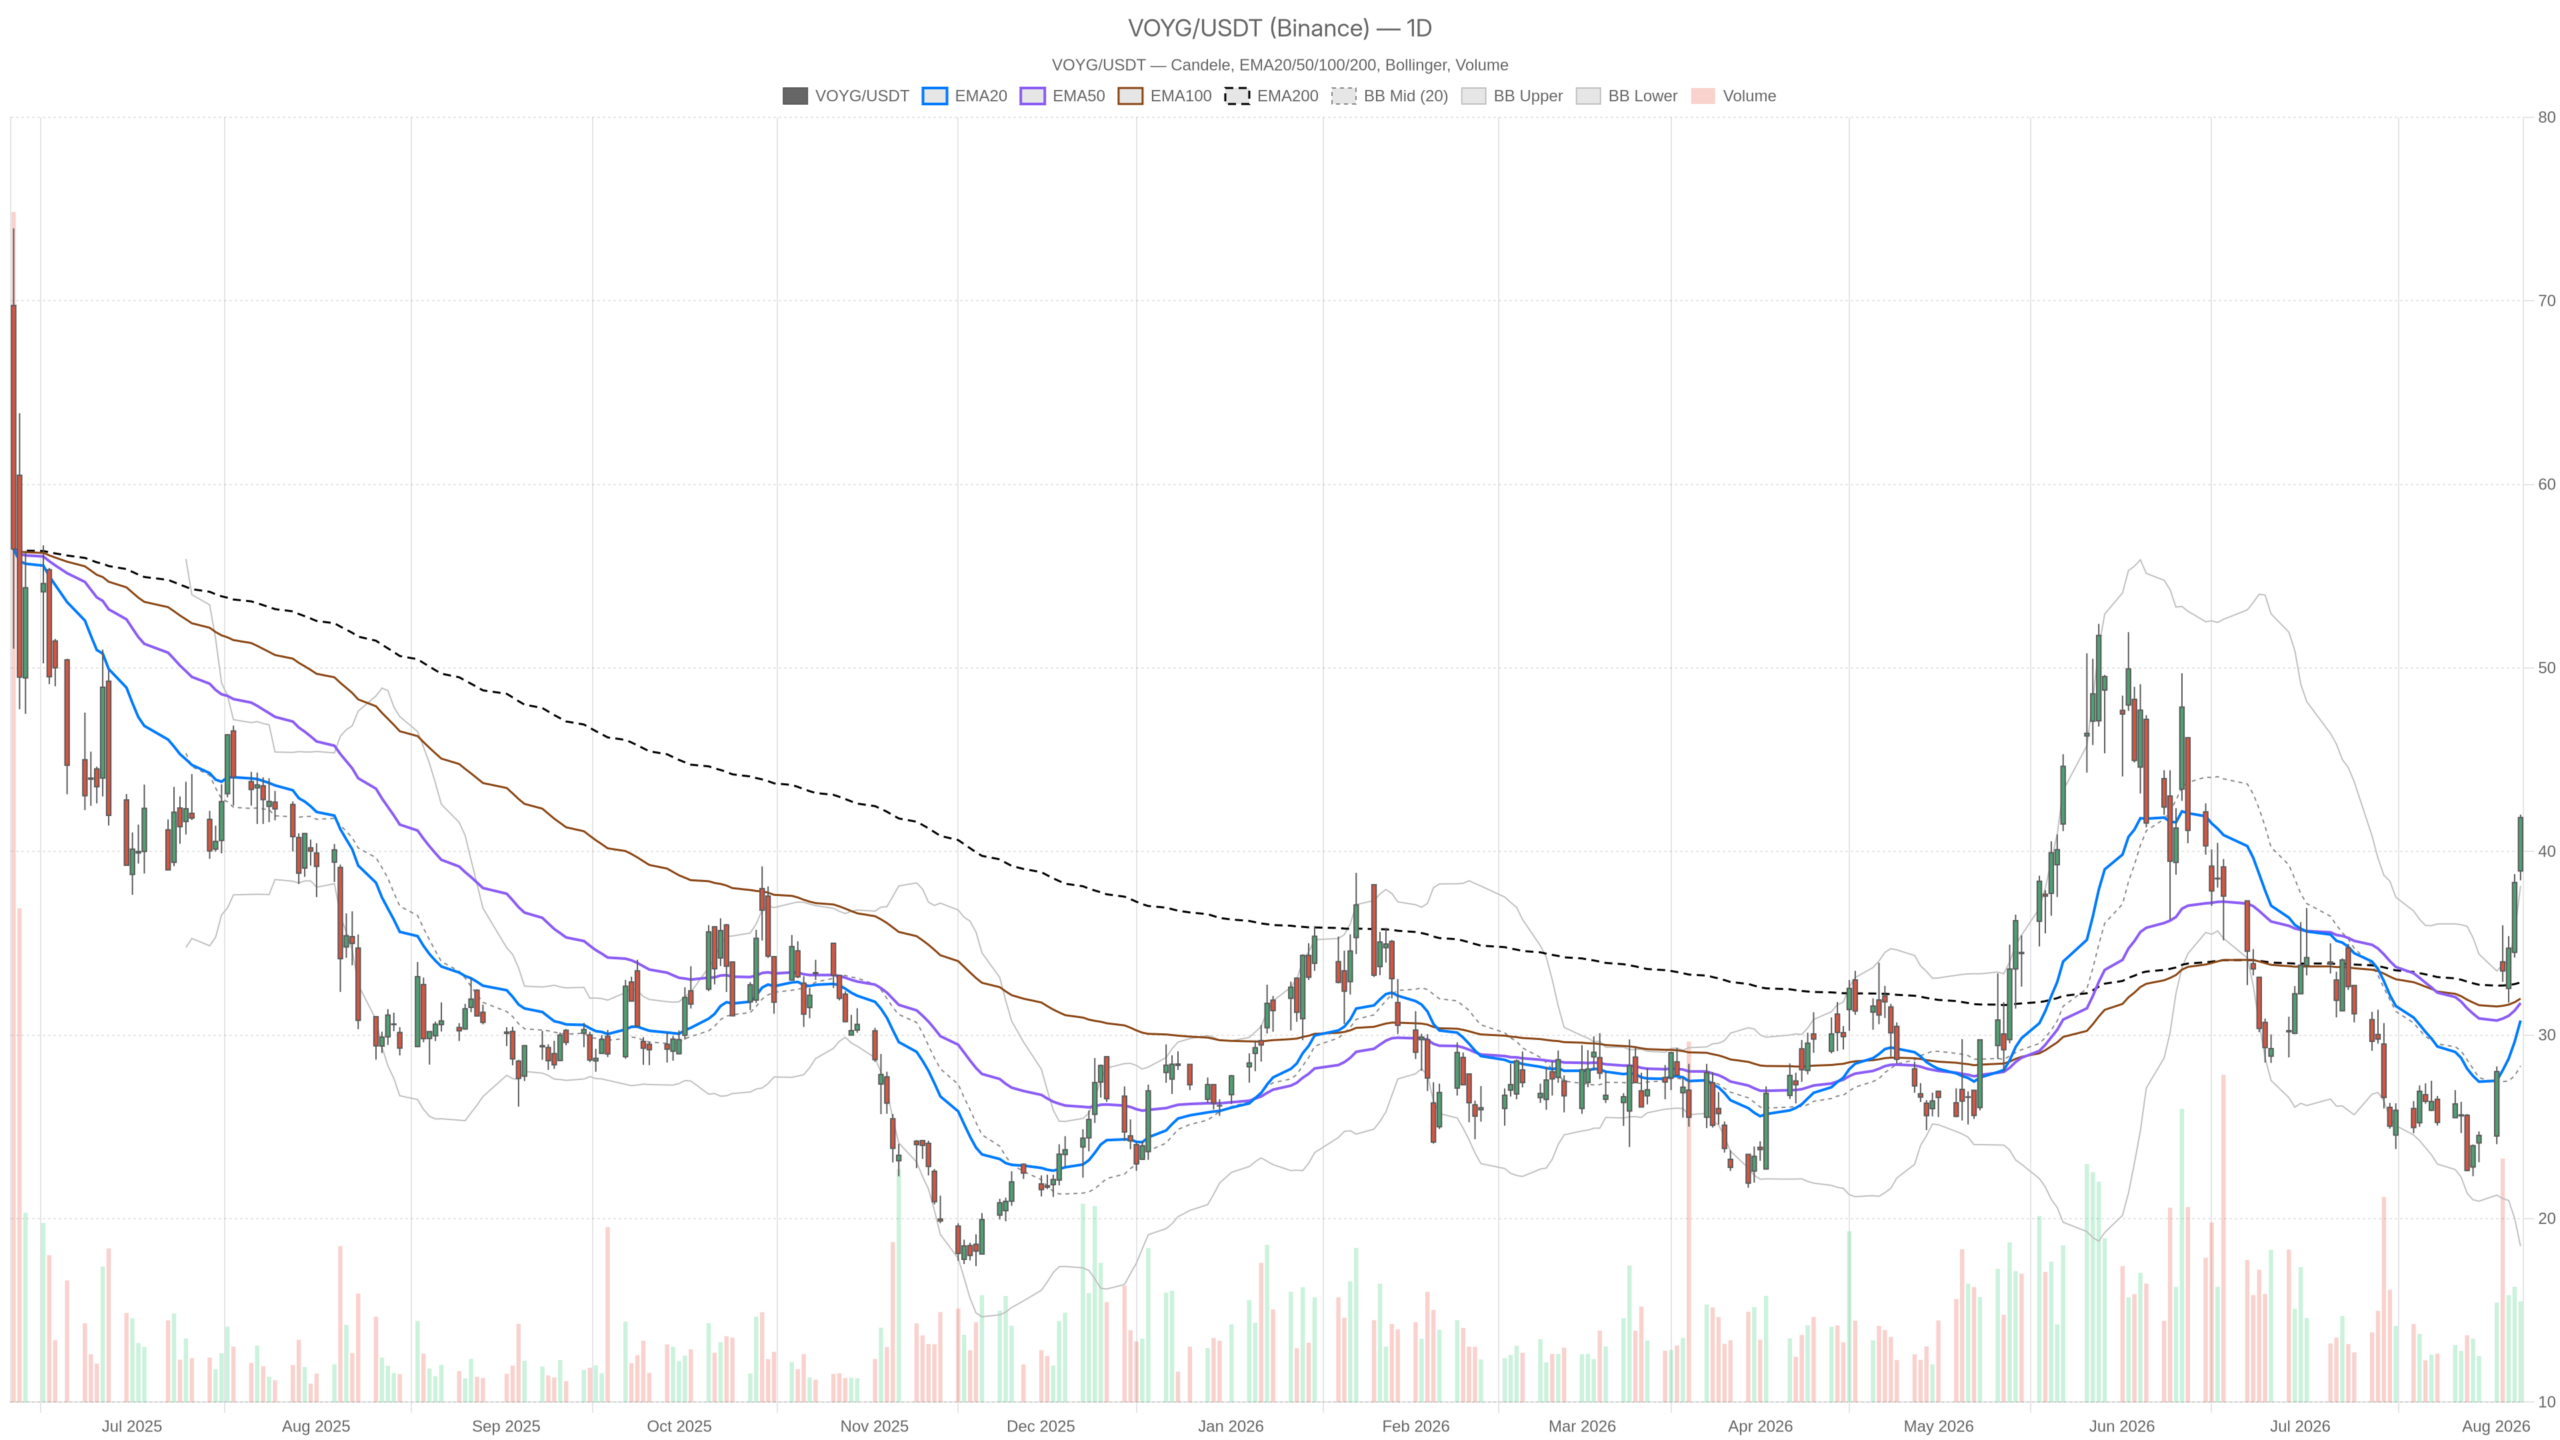
Voyager Technologies, Inc. stock surged to 41.85, closing above the upper Bollinger band on volume of 1.96 million shares. The bias is stretched bullish, yet the daily regime still reads neutral — and that contradiction defines the entire setup.
Key takeaways
- VOYG closed at 41.85, above the daily upper Bollinger band at 38.13, on volume of 1.96 million shares.
- Daily RSI sits at 70.66 (overbought) and hourly RSI at 82.45 (deeply overbought), stacking exhaustion signals across timeframes.
- Q2 2026 revenue reached $52.7 million (up 15% YoY), with bookings of $113 million and a record backlog of $336 million.
- The company was selected by Raytheon to supply propulsion and DACS technology for the Standard Missile 3 interceptor family.
- A failure to hold the daily pivot at 40.76 or S1 at 39.52 would materially weaken the bullish breakout case.
Daily Structure: Price Runs Far Ahead of Moving Averages
The daily chart confirms genuine momentum expansion — but price now sits far above its moving averages. The move is statistically extended and likely needs either digestion or a pullback before any durable trend can develop.
The clustering of the daily EMAs tells you where this stock came from. EMA20 sits at 30.79, EMA50 at 31.74, and EMA200 at 32.87. All three are bunched within roughly two points of each other. That is the signature of a long range-bound phase. Price at 41.85 trades roughly nine points above the 200-day average. Trends do not usually begin from this kind of dislocation without a pullback along the way.
The Bollinger picture reinforces that. Its daily mid-band sits at 28.31, with the upper at 38.13 and the lower at 18.50. Price is now outside the upper band. That confirms genuine strength, but it also means the move is statistically extended relative to its own recent volatility. Closes outside the band tend to resolve through sideways digestion or a sharp mean-reversion snap.
Momentum agrees with the direction. Daily RSI is 70.66, just into overbought territory. The MACD line has crossed to 0.92 against a signal still at -1.18, leaving a histogram of 2.11. This gap between line and signal is unusually wide. That is a fresh, aggressive momentum shift rather than a mature trend. It is exactly the kind of reading that produces both continuation and violent shakeouts.
Volatility has repriced too. Daily ATR14 is 2.91, meaning the market is now pricing roughly a three-point average daily range. Position sizing that made sense on a quiet 30-dollar chart no longer applies at 42 with this ATR.
Levels That Matter on the Daily
The daily pivot sits at 40.76, with R1 at 43.10 and S1 at 39.52. Price is holding above the pivot, which keeps near-term control with buyers. The 43.10 area becomes the first meaningful measured objective on continuation. Below, a loss of 39.52 would be the first real crack in the breakout. It would drag price back inside the upper band.
The 1H Chart Confirms the Trend but Flashes an Exhaustion Warning
Hourly trend structure is unambiguously bullish, with EMAs properly stacked and price above all of them. The EMA20 sits at 38.17, EMA50 at 33.75, and EMA200 at 31.12. Price at 41.88 holds above all three. This validates the daily breakout rather than contradicting it.
Hourly Momentum: The Fuel Gauge Is No Longer Full
However, the hourly momentum reading is where caution enters. RSI14 on the 1H chart is 82.45. That is deeply overbought. It usually appears at the tail end of a thrust rather than at the start of one. Meanwhile, the hourly MACD is flattening: the line at 2.77 sits barely above the signal at 2.71, leaving a histogram of just 0.07. The impulse remains positive but is losing acceleration.
Meanwhile, the hourly Bollinger frame gives useful boundaries. Its mid-band is 38.03 and the upper is 43.26. Price sits inside the band, not outside it. The hourly move is therefore less extended than the daily one. Hourly ATR is 1.21, making intraday swings of over a point normal.
Overall, H1 supports the bullish bias in structure while weakening it in momentum quality. That is the honest reading. The trend is intact, but the fuel gauge is no longer full.
15m Execution Context: Compression Right Under Resistance
The 15-minute chart is doing what it should after a large expansion day — digesting. Price closed at 41.88 inside a very tight range. The high was 42.00, the low 41.65. EMA20 at 41.00 and EMA50 at 39.33 are still rising beneath price. EMA200 is far below at 33.23. The short-term trend remains bullish.
Notably, the micro momentum has already rolled. The 15m MACD histogram is marginally negative at -0.04. Its line at 0.75 has slipped under the signal at 0.79. RSI sits at 72.11, still hot. Bollinger bands are narrow — 40.25 to 42.05 — around a mid at 41.15. ATR of 0.39 confirms compression.
Meanwhile, pivot levels on both intraday frames are almost identical and extremely tight. The pivot sits at 41.84, with R1 near 42.04 and S1 near 41.68. That is a coiled range. Ranges this narrow after a vertical move typically break with force in one direction. The resolution of the 42.04 ceiling is the immediate execution trigger to watch.
Bullish Scenario for Voyager Technologies, Inc. Stock
Fundamentally, the backdrop is doing real work here. Second-quarter 2026 revenue came in at $52.7 million, up 15% year over year. Bookings reached $113 million with a record backlog of $336 million. Management also raised 2026 revenue guidance and pointed to an active acquisition pipeline, including the Astrobotic deal. On top of that, Raytheon selected the company to supply propulsion and DACS technology for the Standard Missile 3 interceptor family.
That combination explains why the market repriced so aggressively in a single session. Backlog growth and a named defence programme win change the narrative. It shifts from speculative space exposure to contracted revenue visibility.
Technically, the bullish case needs continuation acceptance above the 42.00–42.04 intraday ceiling. That would be followed by a push toward the daily R1 at 43.10. Holding the daily pivot at 40.76 on any pullback would keep the structure clean. A shallow consolidation that lets the hourly EMA20 at 38.17 catch up — without breaking it — would be the healthiest possible outcome for trend continuation.
Bearish Scenario: What Invalidates the Voyager Technologies Breakout
On the other hand, the risk profile here is not subtle. Price outside the daily upper band. Daily RSI above 70. Hourly RSI above 82. Momentum histograms flattening on 1H and already negative on 15m. That is a stack of exhaustion signals arriving together.
Meanwhile, the valuation debate adds fuel to the downside case. The stock screens as expensive on market multiples. It scores poorly on broader valuation checks, even after the sharp weekly rally. At the same time, sentiment toward higher-risk space equities is not uniformly warm. Jim Cramer took a cautious stance on the sector on August 5, dismissing Rocket Lab as speculative. Crowded momentum trades in richly valued names unwind quickly when that tone spreads.
Therefore, the bullish case weakens materially on a loss of the intraday pivot cluster near 41.68–41.84. It is seriously damaged below the daily S1 at 39.52. Below that, the reference points thin out fast. The nearest structural magnets are the hourly mid-band at 38.03 and the daily upper band at 38.13. That is the very level price broke out from. A deeper mean-reversion move toward the daily EMA cluster in the low 30s cannot be ruled out. Price has travelled far from that zone. With a daily ATR of 2.91, that ground can be covered in a handful of sessions.
Positioning, Volatility and the Honest Uncertainty
To summarise the timeframe alignment: daily direction is bullish but the daily regime is still flagged neutral. H1 confirms the trend while warning on momentum. And 15m shows compression with a small negative momentum tick. The signals are directionally aligned and qualitatively mixed. That distinction matters.
Therefore, the sensible framing for Voyager Technologies, Inc. stock is a strong but stretched breakout that has not yet been tested. The fundamentals justify a re-rating: record backlog, raised guidance, the Raytheon selection. However, the chart has front-run a lot of that news in one candle. Follow-through above 43.10 would confirm the market is willing to pay up for backlog visibility. Failure to hold 39.52 would suggest the move was a valuation-blind momentum squeeze.
At this stage, volatility is the dominant variable. ATR has expanded across every timeframe. Ranges are wider. Intraday pivot bands are unusually tight against a hot RSI. That mix produces fast, asymmetric moves in both directions. Until price either accepts above R1 or breaks the daily pivot structure, the balance of evidence favours patience over conviction.
FAQ
Is Voyager Technologies, Inc. stock overbought right now?
Yes, across multiple timeframes. The daily RSI sits at 70.66, just into overbought territory. More importantly, the hourly RSI is at 82.45, which is deeply overbought. This typically appears near the end of a momentum thrust rather than at the beginning. Combined with flattening MACD histograms on the 1H chart and a negative reading on the 15m chart, the exhaustion signals are stacked.
What are the key support levels for VOYG?
The immediate support is the intraday pivot cluster near 41.68–41.84. Below that, the daily S1 at 39.52 is the first structural level that would signal a genuine crack in the breakout. Further down, the daily upper Bollinger band at 38.13 and the hourly mid-band at 38.03 form the next zone. A deeper retreat toward the daily EMA cluster in the low 30s is possible given the distance price has travelled from its moving averages.
What fundamental catalysts are driving the Voyager Technologies rally?
Three main catalysts are at work. First, Q2 2026 revenue of $52.7 million grew 15% year over year. Second, the company reported a record backlog of $336 million and raised its full-year 2026 revenue guidance. Third, and perhaps most significantly, Raytheon selected Voyager Technologies to supply propulsion and DACS technology for the Standard Missile 3 interceptor family. This shifts the narrative from speculative space exposure to contracted defence revenue visibility.
What would invalidate the bullish breakout?
The breakout weakens materially on a loss of the intraday pivot cluster near 41.68–41.84. It would be seriously damaged below the daily S1 at 39.52. A move back toward the daily EMA cluster in the low 30s cannot be ruled out, especially given how far price has travelled from its moving averages and the stack of exhaustion signals across multiple timeframes.
Disclaimer: This article is for informational purposes only and does not constitute financial advice, an investment recommendation, or a solicitation to buy or sell any financial instrument or cryptocurrency. The analysis provided is not indicative of future results. Investing in crypto assets and financial markets carries a high risk of capital loss. Always do your own research (DYOR) and consult a qualified financial advisor before making any decision.
Article produced with the assistance of artificial intelligence and reviewed by the editorial team.