



StubHub Holdings, Inc. stock closed the regular session at $8.54, up from an $8.19 open. Yet the Q2 2026 report brought a profit disappointment, sending shares tumbling after hours. The stock now sits between a deteriorating technical trend and a fresh fundamental shock.
Key takeaways
- StubHub Holdings, Inc. stock closed at $8.54 on volume of about 10.05 million shares.
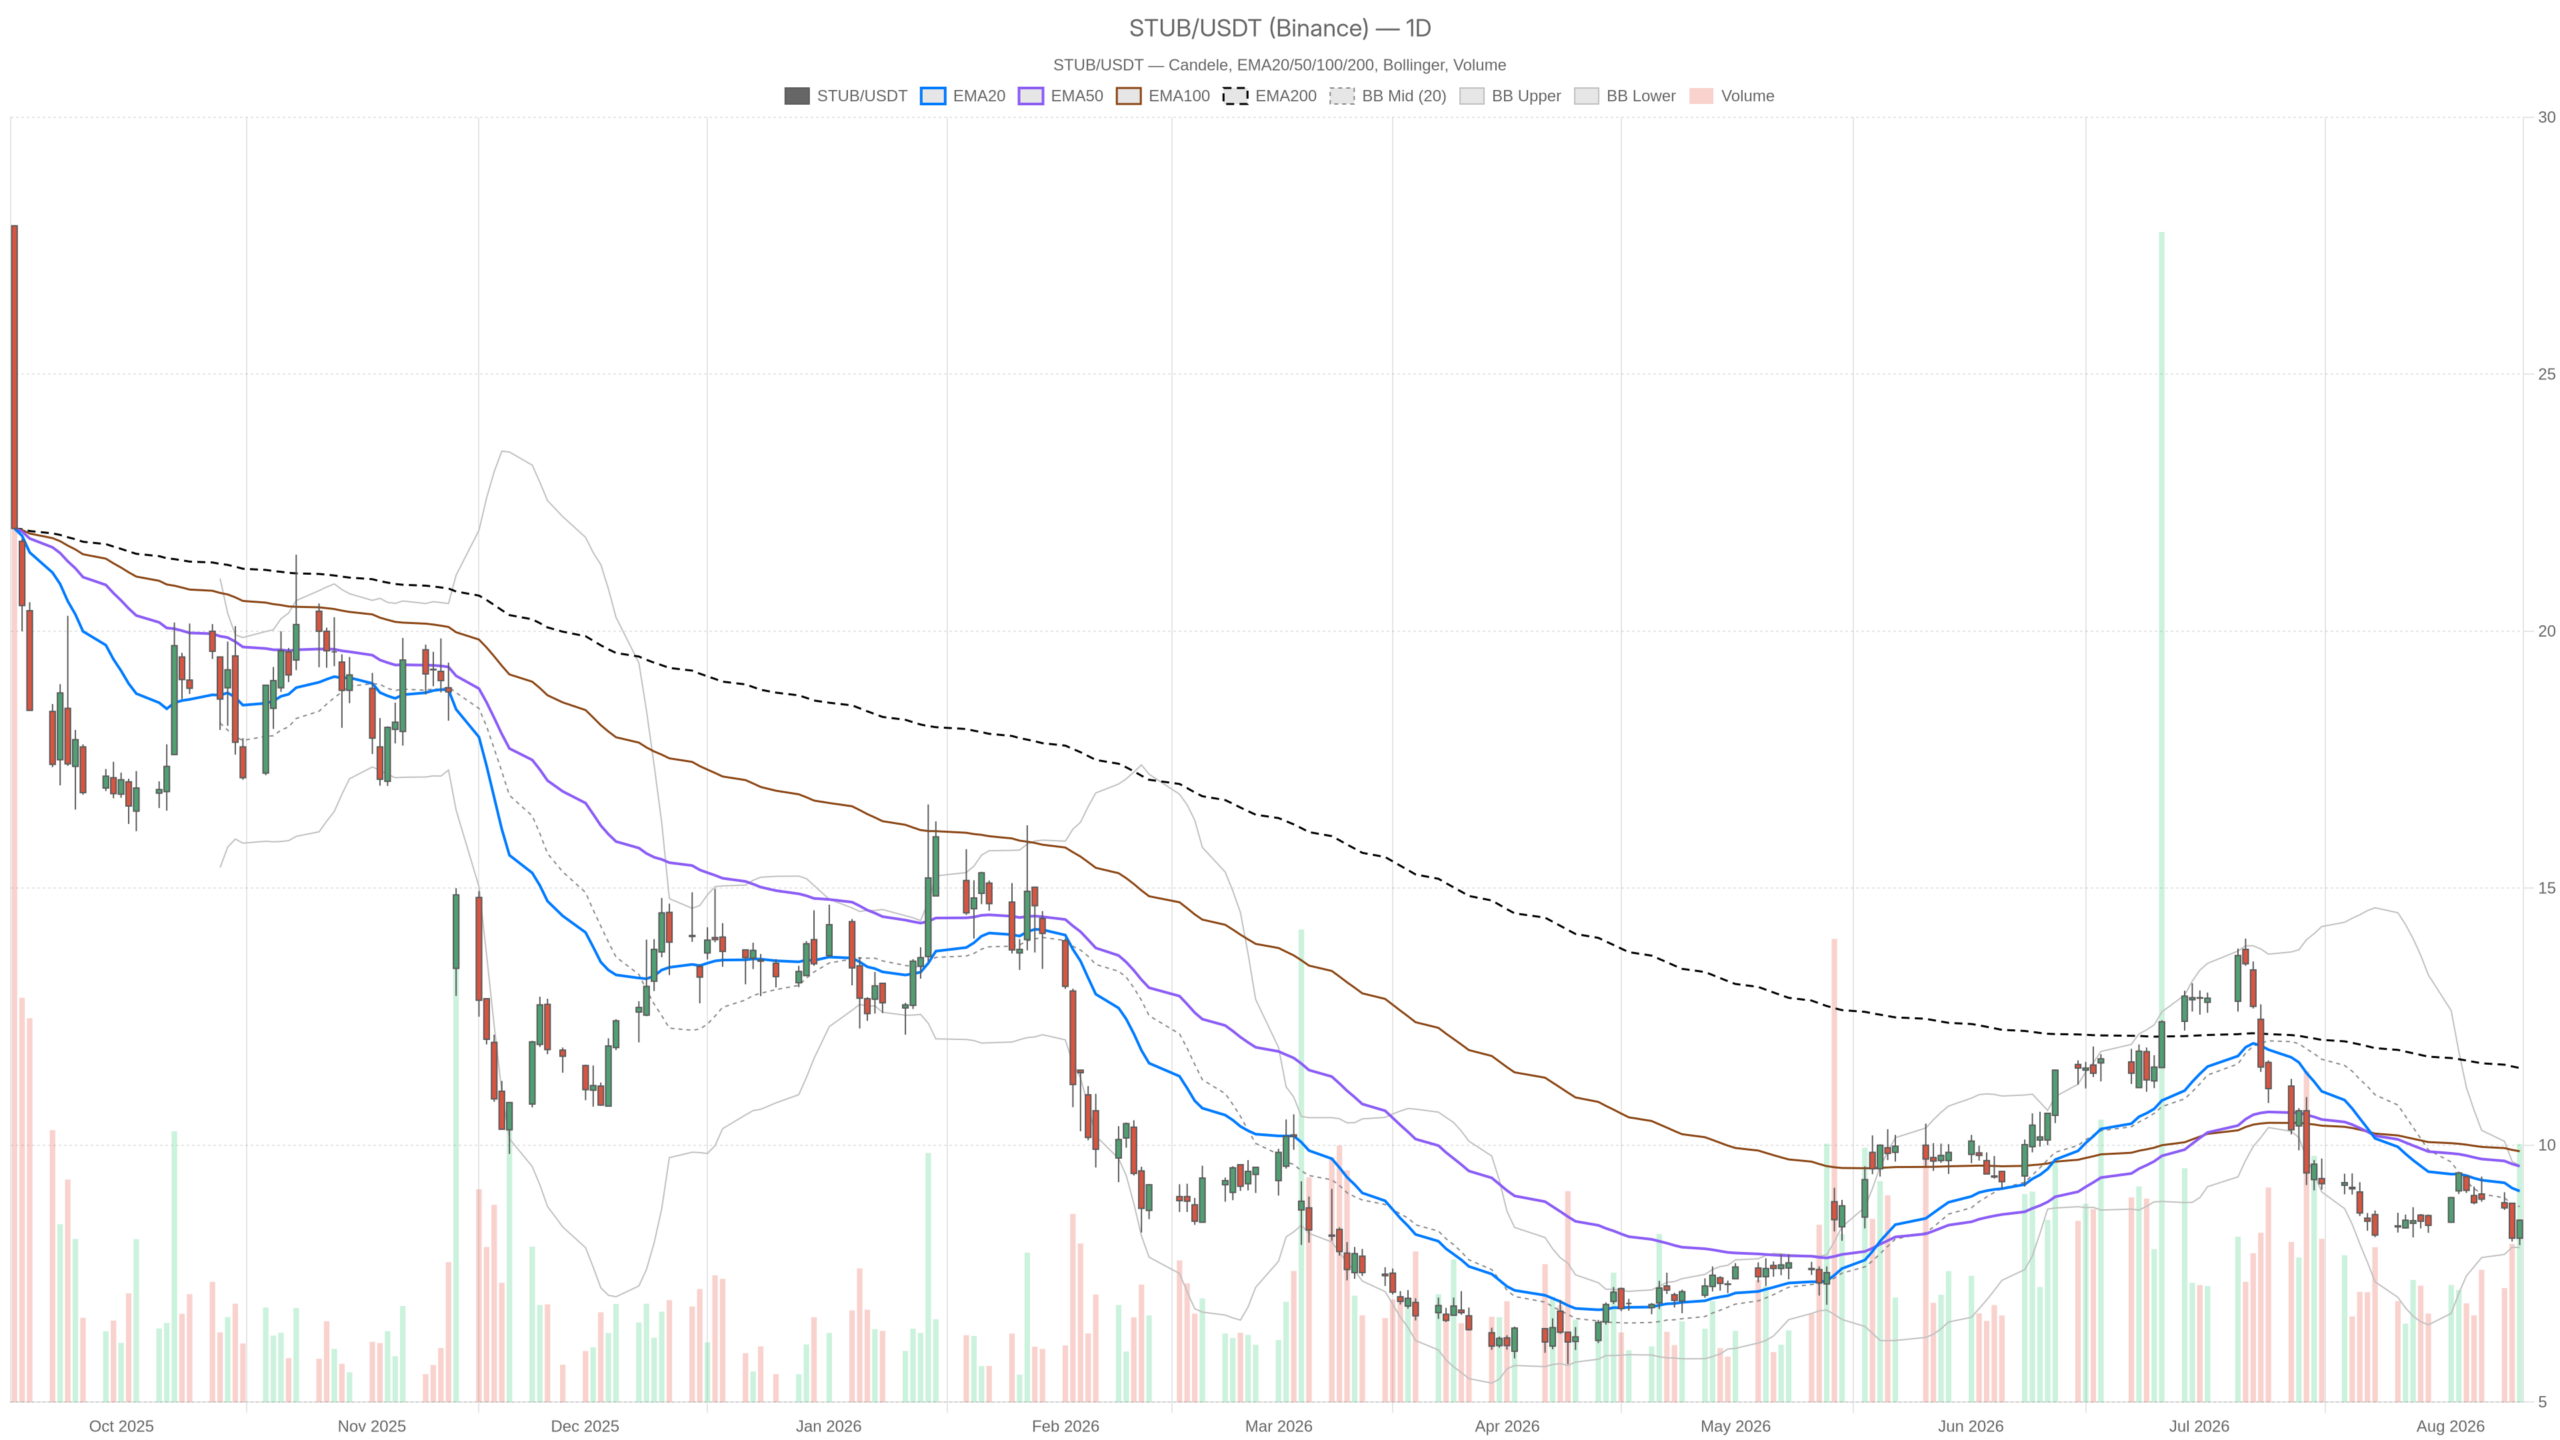
- The daily trend is bearish, with price below the EMA20 at 9.11, EMA50 at 9.59, and EMA200 at 11.5.
- Q2 2026 GMS rose 34% and revenue rose 33% year over year, but profit expectations were missed.
- The stock tumbled after hours despite record sales and a higher GMS outlook.
- Daily ATR14 at 0.45 signals elevated volatility into the next session.
Daily Structure Still Points Lower for StubHub Holdings, Inc. Stock
On the daily timeframe, the trend remains firmly bearish. Price sits below the EMA20 at 9.11, the EMA50 at 9.59, and the EMA200 at 11.5. That stacked alignment confirms the system’s bearish regime. When price trades beneath all three major averages, rallies tend to be treated as selling opportunities rather than trend reversals.
Momentum tells a more nuanced story. The daily RSI reads 40.35, which is weak but not yet oversold. Meanwhile, the MACD line sits at -0.48 against a signal line of -0.52. The histogram is only 0.03. That small positive reading suggests downside momentum is losing some force. Still, the broader trend signal remains negative. Sellers are in control, but their grip may be loosening slightly.
The Bollinger setup reinforces the cautious read. The daily mid band sits at 8.8, with the upper band at 9.6 and the lower band at 8.01. Price closed at 8.54, below the midline and closer to the lower half of the range. At the same time, daily ATR14 stands at 0.45, a meaningful figure relative to a sub-$9 stock. It points to volatility that may intensify once the earnings reaction filters through. On the pivot framework, price closed above the daily pivot of 8.38. It is pressing toward R1 at 8.71, with S1 at 8.21 as the nearest downside marker.
1H Timeframe: A Pause, Not Yet a Reversal
The hourly chart softens the bearish edge without erasing it. Price at 8.55 trades above the EMA20 of 8.5. However, it remains below the EMA50 at 8.71 and the EMA200 at 9.45. That mixed alignment is why the system classifies the 1H regime as neutral. RSI on this timeframe sits at 48.76, essentially balanced. The MACD line at -0.17 versus a signal of -0.18 produces a razor-thin positive histogram of 0.01. Momentum here is flattening rather than turning.
Bollinger bands on the 1H frame show the mid band at 8.53, almost exactly where price is trading. The upper band sits at 9.08 and the lower band at 7.97. Price hugging the midline is typical of consolidation after a sharp move, not a confirmed breakout.
The hourly pivot point at 8.48 has been reclaimed. Price is now testing toward R1 at 8.63, with S1 at 8.4 as the first line of defense. Overall, the 1H picture confirms that immediate downside pressure has eased. It does not yet confirm a bullish reversal against the daily trend.
15-Minute Execution Context
Zooming into the 15-minute chart, the tape looks noticeably more constructive for this narrow window. Price at 8.55 trades above the EMA20 at 8.31 and the EMA50 at 8.4. It remains under the EMA200 at 8.71. RSI has climbed to 66.46, edging toward overbought territory. The MACD line at 0.03 versus a signal of -0.02 produces a positive histogram of 0.05. That is a clear short-term bullish tilt.
Notably, price at 8.55 is trading above the 15-minute upper Bollinger band of 8.49. This signals strong intraday buying pressure, which often precedes either a continuation push or a short-term exhaustion move. The 15-minute pivot point sits at 8.51, with R1 at 8.59 just overhead and S1 at 8.46 below. This data reflects the pre-earnings tape. It should be read as execution context only, not as a signal that overrides the daily trend. After-hours headlines already point to renewed selling.
The Earnings Conflict Behind the Charts
This is where the technical and fundamental pictures diverge. StubHub’s Q2 2026 slides showed GMS surging 34%. The earnings call transcript confirmed revenue jumping 33% year over year. It also reported record sales, strong cash flow, and a higher GMS outlook. On paper, that is a strong quarter. However, StubHub missed profit expectations. Multiple reports describe the stock falling on its outlook and tumbling after hours despite those top-line gains.
That combination, a headline beat undermined by a bottom-line miss, is exactly the kind of catalyst that can override short-term technical setups. The 15-minute strength into the close likely reflected positioning ahead of the print rather than conviction about what followed. In contrast, the daily bearish structure was already in place before the report. It appears to align more closely with the after-hours reaction than the intraday bounce did.
Bullish Scenario
For a genuine bullish case, StubHub Holdings, Inc. stock would need to stabilize above the daily pivot at 8.38. It would also need to clear R1 at 8.71 on a sustained basis. A push toward the daily Bollinger midline at 8.8, then the EMA20 at 9.11, would be the next test. Confirmation would require the daily RSI moving back above 50. The MACD histogram would need to extend its recent positive tilt rather than fade.
On the 1H frame, reclaiming the EMA50 at 8.71 and then the EMA200 at 9.45 would strengthen the argument. It would suggest the after-hours selling was a short-lived overreaction to the profit miss rather than the start of a deeper leg down.
Bearish Scenario
The bearish case currently has the daily trend on its side. It would be reinforced by a rejection near the pivot or R1 zone around 8.71. A break below S1 at 8.21, then the daily Bollinger lower band at 8.01, would confirm renewed downside. It would show earnings-driven weakness compounding an already established downtrend. With the EMA200 sitting far overhead at 11.5, the daily chart shows how much ground has been lost.
A resumption of selling would likely see price gravitate back toward the lower Bollinger region. On the hourly chart, a failure to hold the EMA20 at 8.5 would be an early warning sign. It would indicate the neutral pause is giving way to renewed downside.
Closing Take
Overall, StubHub Holdings, Inc. stock sits in a genuinely conflicted setup heading into the next session. The daily trend remains bearish, and the hourly chart is neutral. The 15-minute tape showed pre-earnings strength that the after-hours reaction has since called into question. Daily ATR14 at 0.45 and the scale of the after-hours move both point to elevated volatility ahead. Positioning should account for sharp, headline-driven swings rather than a clean continuation in either direction. This analysis is not investment advice.
FAQ
What is the current price of StubHub Holdings, Inc. stock?
It closed the regular session at $8.54, after opening at $8.19 and printing a session high of $8.55 on volume of roughly 10.05 million shares.
Is StubHub Holdings, Inc. stock in a bullish or bearish trend?
The daily trend is bearish. Price sits below the EMA20 at 9.11, the EMA50 at 9.59, and the EMA200 at 11.5, with a daily RSI of 40.35.
Why did StubHub Holdings, Inc. stock fall after earnings?
Q2 2026 GMS rose 34% and revenue rose 33% year over year, but the company missed profit expectations. Reports described the stock tumbling after hours on its outlook.
What key levels should traders watch for StubHub Holdings, Inc. stock?
The daily pivot is 8.38, with R1 at 8.71 and S1 at 8.21. The daily Bollinger lower band sits at 8.01, while the EMA20 at 9.11 is the next resistance test.
Disclaimer: This article is for informational purposes only and does not constitute financial advice, an investment recommendation, or a solicitation to buy or sell any financial instrument or cryptocurrency. The analysis provided is not indicative of future results. Investing in crypto assets and financial markets carries a high risk of capital loss. Always do your own research (DYOR) and consult a qualified financial advisor before making any decision.
Article produced with the assistance of artificial intelligence and reviewed by the editorial team.