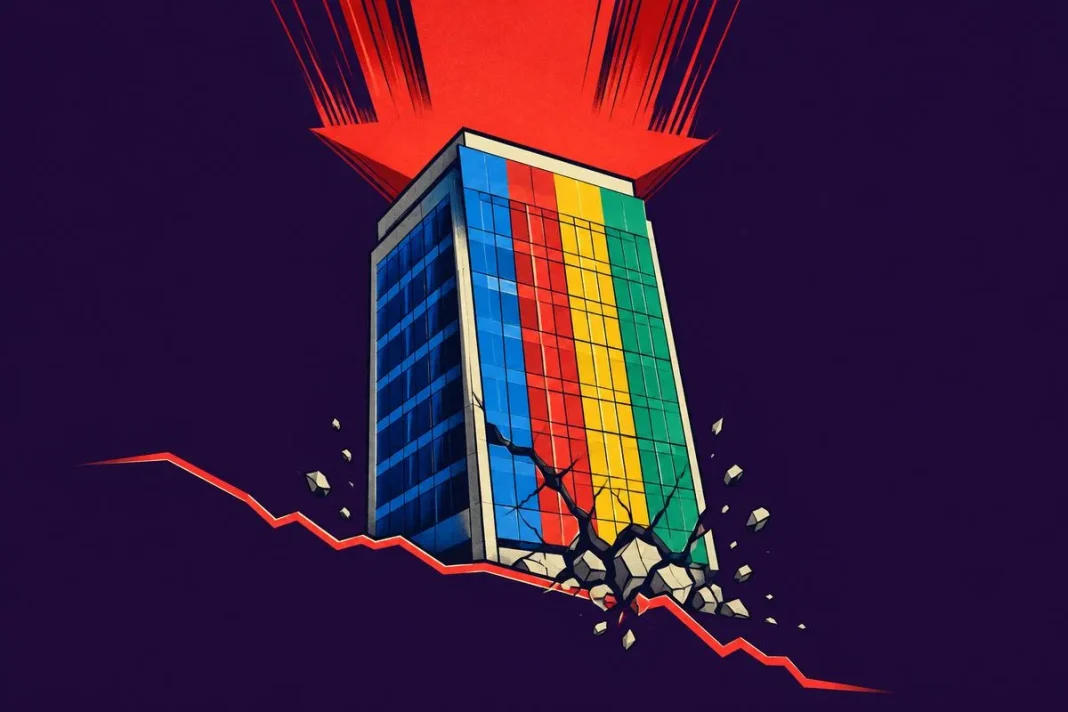

Google stock has a bearish daily setup after Alphabet’s earnings, with price below its main exponential averages and the lower Bollinger band. The hourly chart confirms that bias. However, oversold RSI readings across all three timeframes complicate the outlook: they flag stretched conditions, not evidence of a bullish reversal.

Key takeaways
- Google stock was trading at $280.02 as of 09:42 ET, down 13.01% from the previous close.
- Daily RSI14 is 21.55, hourly RSI14 is 15.06, and 15-minute RSI14 is 9.61 — all in oversold territory.
- Price sits below the daily 20-session EMA at $327.13, 200-session EMA at $328.25, and 50-session EMA at $335.78.
- The daily MACD line at -9.44 is below its signal at -4.55, with the histogram at -4.9.
- Daily ATR14 rose to $10.47 from $7.92, indicating higher volatility than the prior session.
On Thursday, October 29, 2026, Alphabet opened at $283.84 and traded between a low of $278.3 and a high of $284.72. It was trading at $280.02 as of 09:42 ET, down 13.01% from the previous close, with volume of 387193 shares so far. The session remained open. Alphabet opened at $283.84, traded between a low of $278.30 and a high of $284.72, and was last at $280.02, against a previous close of $321.89.
Meanwhile, reports published before Thursday’s open linked the decline to third-quarter earnings, released after the bell Wednesday. CNBC reported that negative free cash flow was larger than analysts expected, while Alphabet maintained its spending guidance for the year. That earnings context accompanies a chart whose main reference levels sit above the current price.
Google stock: Daily structure favors the bearish case
Price sits below the daily 20-session EMA at $327.13, the 200-session EMA at $328.25 and the 50-session EMA at $335.78. These averages form overhead reference levels, although their order is not a fully bearish alignment. It also sits below the daily lower Bollinger band at $299.87, with the mid-band at $333.56. That position highlights the downside extension without establishing a floor.
Notably, daily RSI14 fell to 21.55 from 38.47, placing it in oversold territory. The daily MACD line is -9.44, below its signal at -4.55. Its histogram declined to -4.9 from -2.75, leaving the momentum evidence bearish despite the oversold RSI.
At the same time, daily ATR14 rose to $10.47 from $7.92, indicating greater absolute volatility than on the preceding daily candle. Price is below the daily first support, S1, at $320, the daily pivot at $321.57 and first resistance, R1, at $323.45. These levels come from the previous completed daily candle and apply to the current session. Despite its support label, S1 is now an overhead reference.
Hourly confirmation and short-term timing
Consistent with the daily picture, the hourly chart for Google stock supports the bearish view. Price is below the 20-hour EMA at $315.98, followed by the 50-hour EMA at $322.14 and 200-hour EMA at $333.73. This is a complete bearish alignment. It also sits below the hourly lower Bollinger band at $298.81, reinforcing the downside extension.
However, hourly RSI14 fell to 15.06 from 56.51 and is oversold. The hourly MACD histogram crossed below zero to -1.72 from 1.02. Its line at -3.43 is below the signal at -1.71, confirming bearish momentum rather than contradicting the daily picture.
For execution context, the 15-minute RSI14 is 9.61, also oversold. Its MACD line at -2.66 sits below the signal at 0.05, with a negative histogram of -2.71. Price remains below the 15-minute 20-period EMA at $317.16 and the 15-minute pivot at $321.97. These are short-term reference levels, not grounds to override the daily bias.
Bullish and bearish scenarios
A bullish scenario requires the session low at $278.3 to hold and price to clear the session high at $284.72. Beyond that, reclaiming the hourly lower Bollinger band at $298.81 would be an initial improvement. Reclaiming the daily lower band at $299.87 would provide further support for that case. Neither condition is met at the current price.
In contrast, a break below $278.3 would invalidate that near-term bullish setup and support the bearish continuation case. Below $278.3, the supplied levels show no lower reference. Oversold readings alone do not invalidate the bearish daily structure.
Overall, Google stock stands below the session high and the key daily averages, with $278.3 the immediate downside reference. Daily ATR14 at $10.47 underscores the volatility. The unresolved question is whether oversold conditions can accompany a reclaim of overhead levels. The current hourly evidence does not yet confirm that outcome.
FAQ
What are the key levels to watch for Google stock?
The session low at $278.3 is the immediate downside reference. On the upside, the session high at $284.72 must be cleared for any bullish case to develop. Beyond that, the hourly lower Bollinger band at $298.81 and the daily lower band at $299.87 are the next reference levels overhead.
Is Google stock in oversold territory?
Yes, across all three timeframes examined. Daily RSI14 is 21.55, hourly RSI14 is 15.06, and 15-minute RSI14 is 9.61. All three readings sit well below the traditional 30 threshold, indicating stretched conditions rather than evidence of a reversal.
What does the daily trend structure show for Google stock?
Price is below the daily 20-session EMA at $327.13, the 200-session EMA at $328.25, and the 50-session EMA at $335.78. The daily MACD line at -9.44 remains below its signal at -4.55, with the histogram at -4.9. The hourly chart shows a complete bearish alignment of moving averages, reinforcing the daily bias.
Disclaimer: This article is for informational purposes only and does not constitute financial advice, an investment recommendation, or a solicitation to buy or sell any financial instrument. The analysis provided is not indicative of future results. Investing in financial markets carries a high risk of capital loss. Always do your own research (DYOR) and consult a qualified financial advisor before making any decision.
Cryptonomist and the author hold no positions in the financial instruments mentioned and receive no compensation from the companies covered.
Article produced with the assistance of artificial intelligence and reviewed by the editorial team.