
Sandisk stock is navigating a sharp intraday pullback within a structurally dominant uptrend. SNDK closed at $1,963.60 after hitting $2,060 intraday. The daily chart remains unambiguously bullish, but the hourly tape demands caution.
Key takeaways
- SNDK closed at $1,963.60 following an 11% intraday drop amid broad sector-wide selling in memory names.
- The daily trend structure remains firmly bullish, with price holding above all key EMAs and the MACD still positive.
- Hourly RSI at 34.84 nears oversold territory, while the hourly MACD has turned outright bearish with a deeply negative histogram.
- Critical daily support sits at $1,922.40; a sustained break below this level would damage the short-term trend.
- The AI-driven NAND demand thesis remains structurally intact despite the intraday correction.
Daily Timeframe: The Bull Case Still Holds for Sandisk Stock
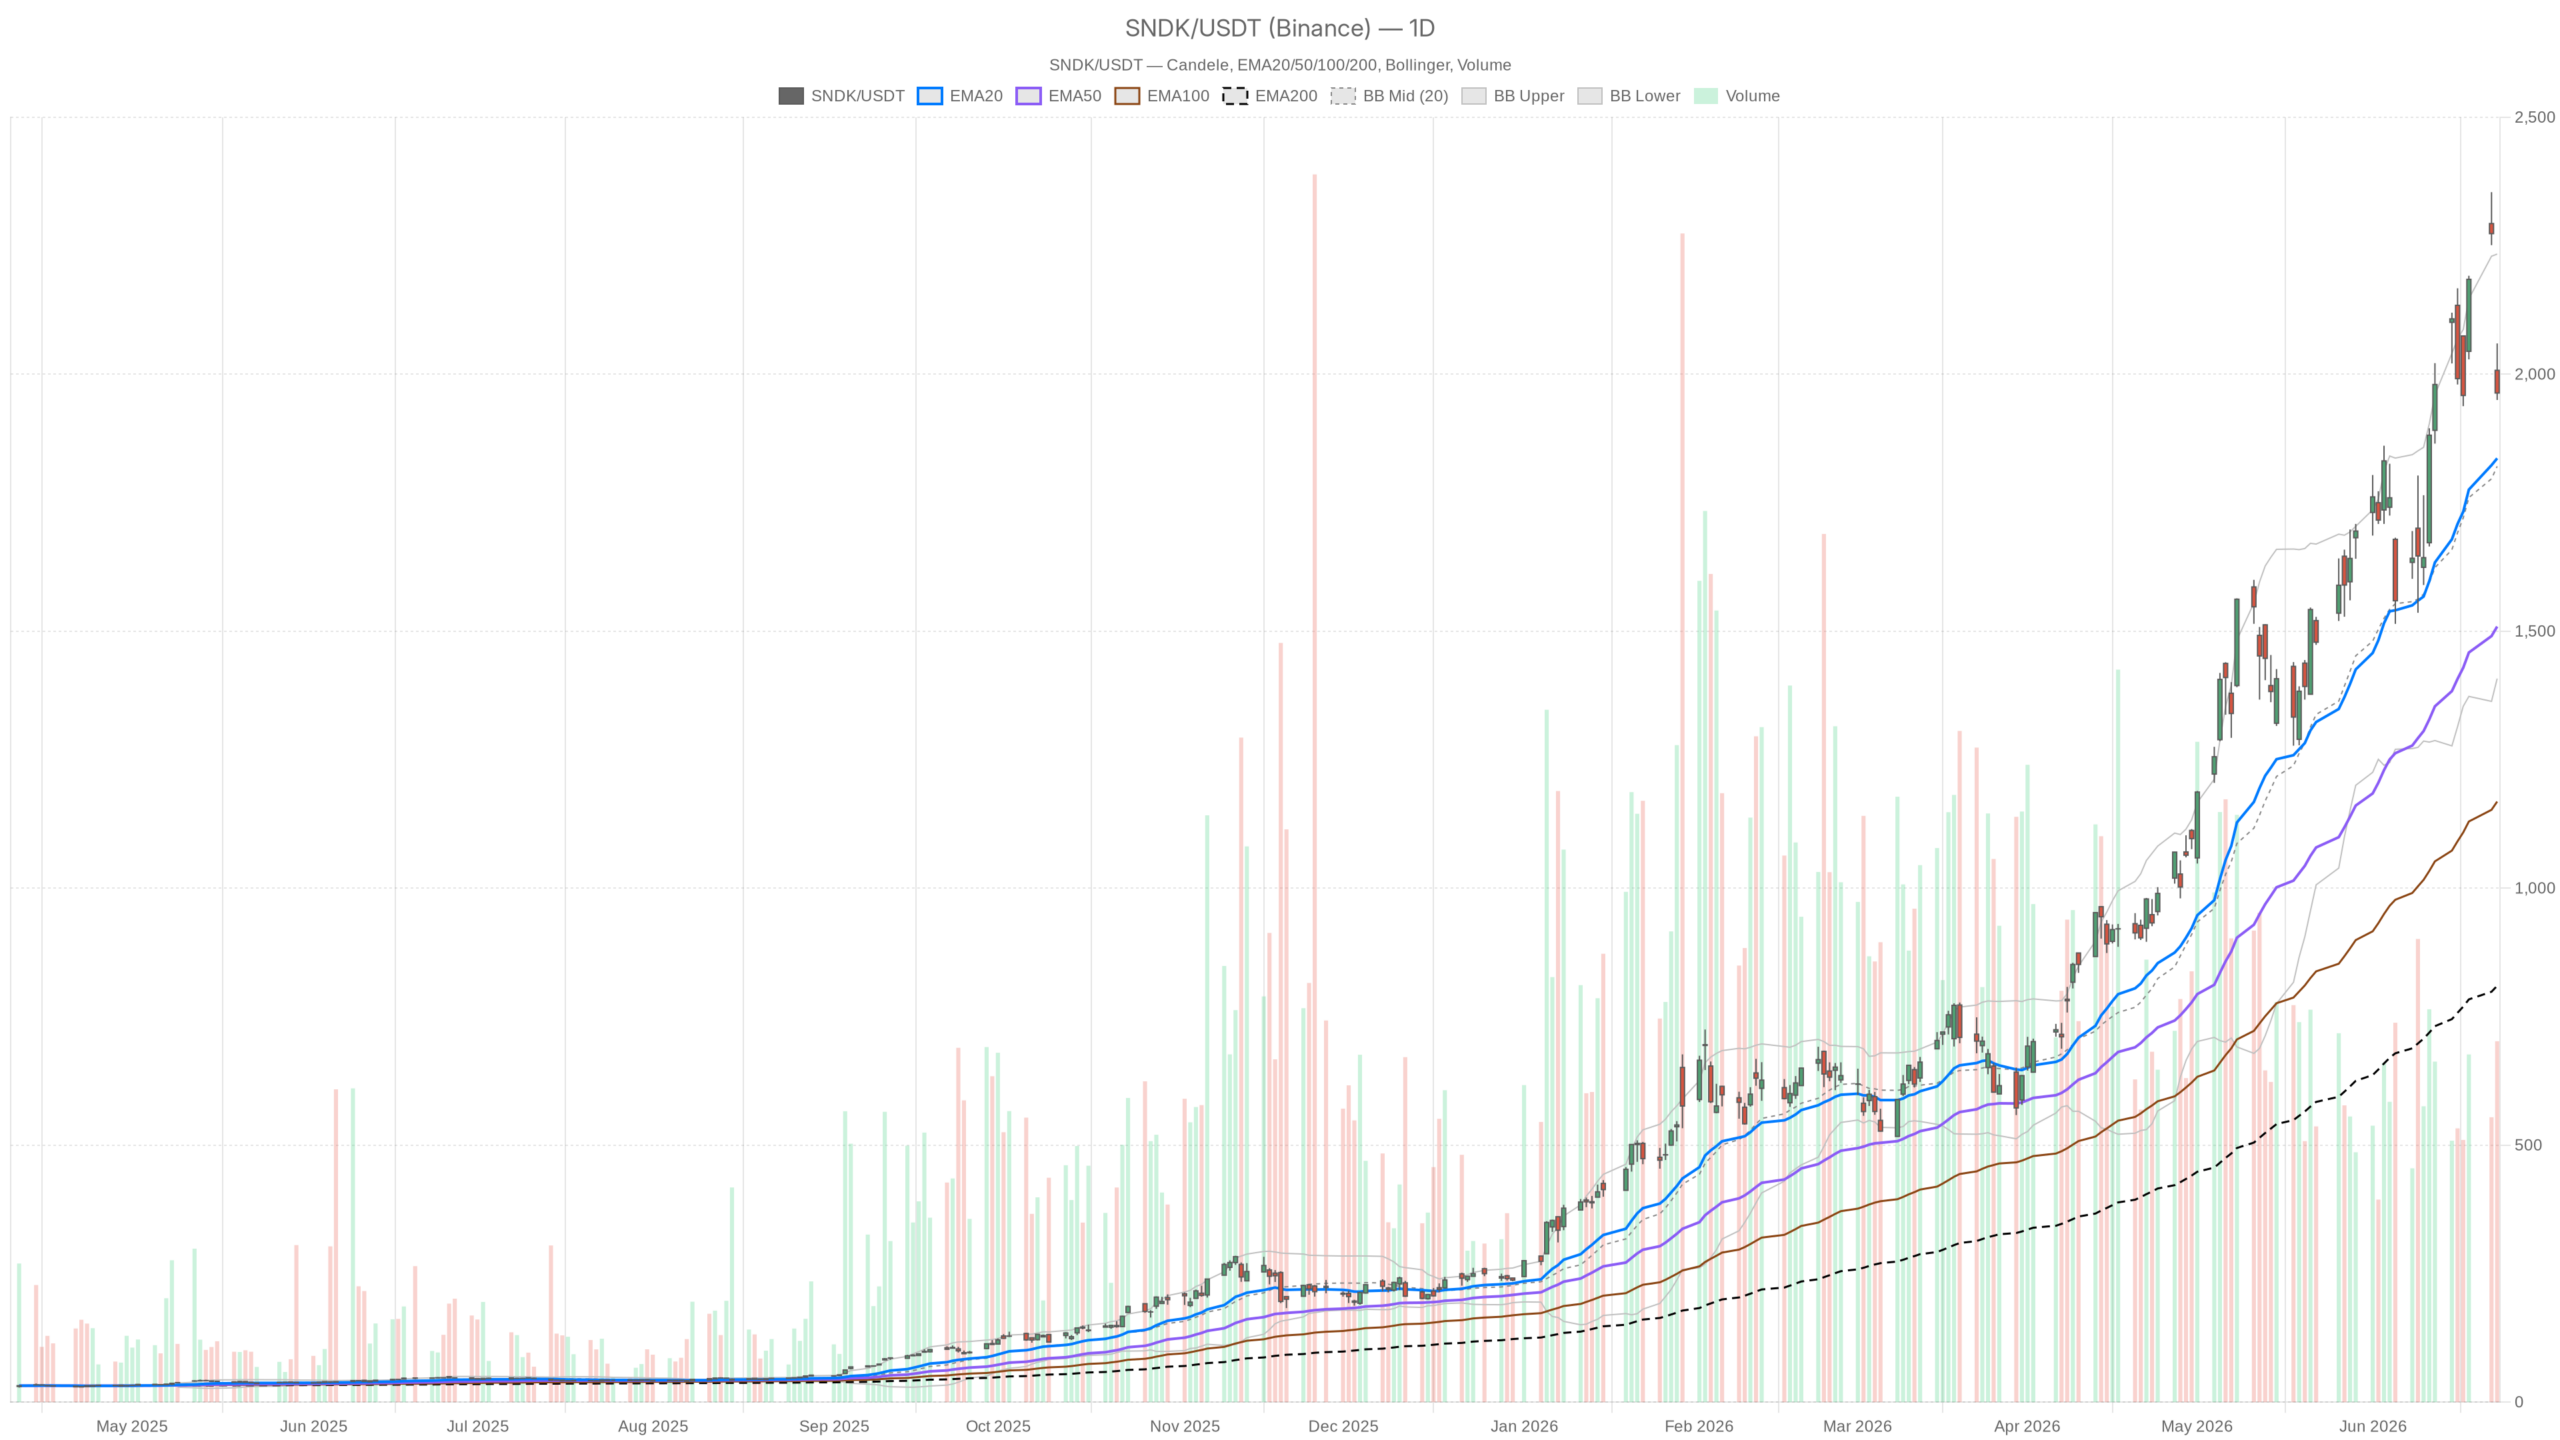
The daily trend structure for Sandisk stock remains firmly intact, with price holding well above all key moving averages. On the daily chart, the EMA stack is steeply aligned. Price sits above the 20-day EMA at $1,836. That level, in turn, is well above the 50-day at $1,509 and the 200-day at just $810. Such separation between short and long-term moving averages signals a trend that has been running hard and long.
Trend Structure and Momentum
Daily RSI at 57.79 is notably constructive. It has pulled back from overbought conditions without breaking below 50. This signals that momentum is correcting, not collapsing. The MACD configuration remains positive: the line sits at 189.86, well above the signal at 174.71, with a histogram of +15.14. This is not a momentum breakdown. It is a deceleration within an uptrend.
Range and Pivot Levels
Bollinger Bands frame the range well. The midband sits at $1,820.90, with the upper band at $2,233.91 and the lower at $1,407.89. At $1,963.60, Sandisk stock is trading comfortably between mid and upper — still in the bullish half of the range. The ATR of 191.38 underscores that this is a high-volatility name. Tuesday’s intraday swing from $2,060 to $1,950 is, by that measure, almost routine.
Pivot analysis gives immediate structure. The daily pivot point sits at $1,991.20, with resistance at $2,032.40 and support at $1,922.40. A close below $1,922 would begin to shift the short-term daily narrative. Meanwhile, a reclaim of $2,032 would restore bullish momentum toward prior highs.
Hourly Timeframe: A Genuine Warning for Sandisk Stock
The hourly chart warns of genuine near-term pressure on Sandisk stock, with price now trading below both the 20-hour and 50-hour EMAs. Price is currently below the 20-hour EMA at $2,089.83 and the 50-hour at $2,042.95. This is a meaningful bearish signal at this resolution. The hourly regime is classified as neutral. However, the price action tells a more defensive story.
Hourly RSI at 34.84 is approaching oversold territory. This is a double-edged reading. It signals selling pressure has been intense. At the same time, it raises the odds of a technical bounce if buyers step in near support. In contrast, the hourly MACD is outright bearish. The line is at -26.06 against a signal of +14.37, with a histogram of -40.43. That negative spread reflects a rapid shift in short-term momentum the daily MACD has not yet captured.
The hourly Bollinger midband is at $2,156.26. Price is well below it, pressing toward the lower band at $1,885.57. On this timeframe, Sandisk stock sits in the lower portion of its recent range. This typically attracts mean-reversion interest — but is not a bottom signal in isolation. The hourly pivot support at $1,945.93 is the next key level to watch. A break below it risks accelerating toward the $1,885 area.
15-Minute Frame: Execution Context
The 15-minute chart shows early signs of selling exhaustion for Sandisk stock, though no reversal is yet confirmed. RSI at 33.92 is near oversold. Meanwhile, the MACD histogram has turned marginally positive at +9.34, even though both the line and signal remain deeply negative. That histogram flip can be an early signal of short-term momentum exhaustion. It suggests a potential pause in the selling, not a reversal.
Notably, the 15-minute Bollinger Bands are tight: upper at $2,011.33, lower at $1,946.10, with price closing near $1,961.07. This compression near the lower band, combined with a mildly improving MACD histogram, gives short-term traders a clear reference point. The $1,946–$1,950 zone appears to be the immediate support cluster across both the hourly and 15-minute pivot grids.
Bullish Scenario for Sandisk Stock
The bull case for Sandisk stock depends on Tuesday’s sell-off proving to be a sector-wide overreaction rather than the start of a sustained de-rating. If SNDK holds above the $1,922–$1,946 support band, the trend resumes from a higher base. A reclaim of the $1,991 daily pivot would reinforce this. A recovery through $2,032 would confirm that the intraday damage was absorbed. Structurally, the AI-driven NAND demand thesis remains intact. Long-term contractual revenues and cloud-driven TLC/QLC adoption are not one-day stories. Sandisk stock has the momentum profile to retest its record highs above $2,060 if macro sentiment stabilizes. A Korean market recovery would support this move.
Bearish Scenario
The bearish scenario for Sandisk stock hinges on a sustained break below $1,922, which would open a path toward the $1,800–$1,820 zone. A break below $1,922.40 on the daily chart would damage the short-term trend and expose the area near the daily Bollinger midband. The hourly MACD deterioration is the most credible near-term risk signal. If AI-related memory spending genuinely slows, the correction could extend beyond a single session. South Korean instability could also trigger further global risk-off rotation.
At a stock that has rallied 10x, the bar for disappointment is extraordinarily high. Valuations leave little margin for error on the demand side.
Positioning and Volatility
Sandisk stock remains structurally bullish on the daily timeframe, but short-term momentum is clearly negative, demanding patience over conviction. The daily ATR of $191 means this stock can move significantly in either direction without technically breaking its trend. That volatility cuts both ways. Traders with existing long exposure have clear risk reference at $1,922 on the daily and $1,946 on the intraday charts. Those looking to add should wait for hourly momentum confirmation — specifically a MACD line crossover back above zero — before stepping in. The daily bias is bullish, but the short-term setup demands patience over conviction.
FAQ
Is Sandisk stock still in a bull trend?
Yes, the daily trend structure remains firmly bullish. Price holds above all key EMAs — the 20-day at $1,836, the 50-day at $1,509, and the 200-day at $810. The daily MACD remains positive, and RSI at 57.79 is constructive. The current sell-off appears to be a short-term correction within a dominant uptrend.
What is the key support level to watch for Sandisk stock?
The critical daily support sits at $1,922.40. A sustained break below this level would damage the short-term trend and potentially open a path toward the $1,800–$1,820 zone near the daily Bollinger midband. On the intraday charts, the $1,946–$1,950 zone serves as immediate support.
What caused the sell-off in Sandisk stock?
Tuesday’s sell-off was triggered by a historic crash in South Korea’s Kospi and growing concerns about the sustainability of AI-related memory spending. Sandisk fell roughly 11% intraday alongside Micron and other memory names in a broad sector-wide rotation driven by macro risk aversion.
Should traders buy Sandisk stock on this dip?
While the daily trend remains bullish, short-term momentum has not yet confirmed stabilization. The hourly MACD is still negative, and price trades below both the 20-hour and 50-hour EMAs. Traders may consider waiting for an hourly MACD line crossover back above zero before adding exposure. The immediate risk reference sits at $1,922 on the daily chart.
Disclaimer: This article is for informational purposes only and does not constitute financial advice, an investment recommendation, or a solicitation to buy or sell any financial instrument or cryptocurrency. The analysis provided is not indicative of future results. Investing in crypto assets and financial markets carries a high risk of capital loss. Always do your own research (DYOR) and consult a qualified financial advisor before making any decision.
Article produced with the assistance of artificial intelligence and reviewed by the editorial team.