



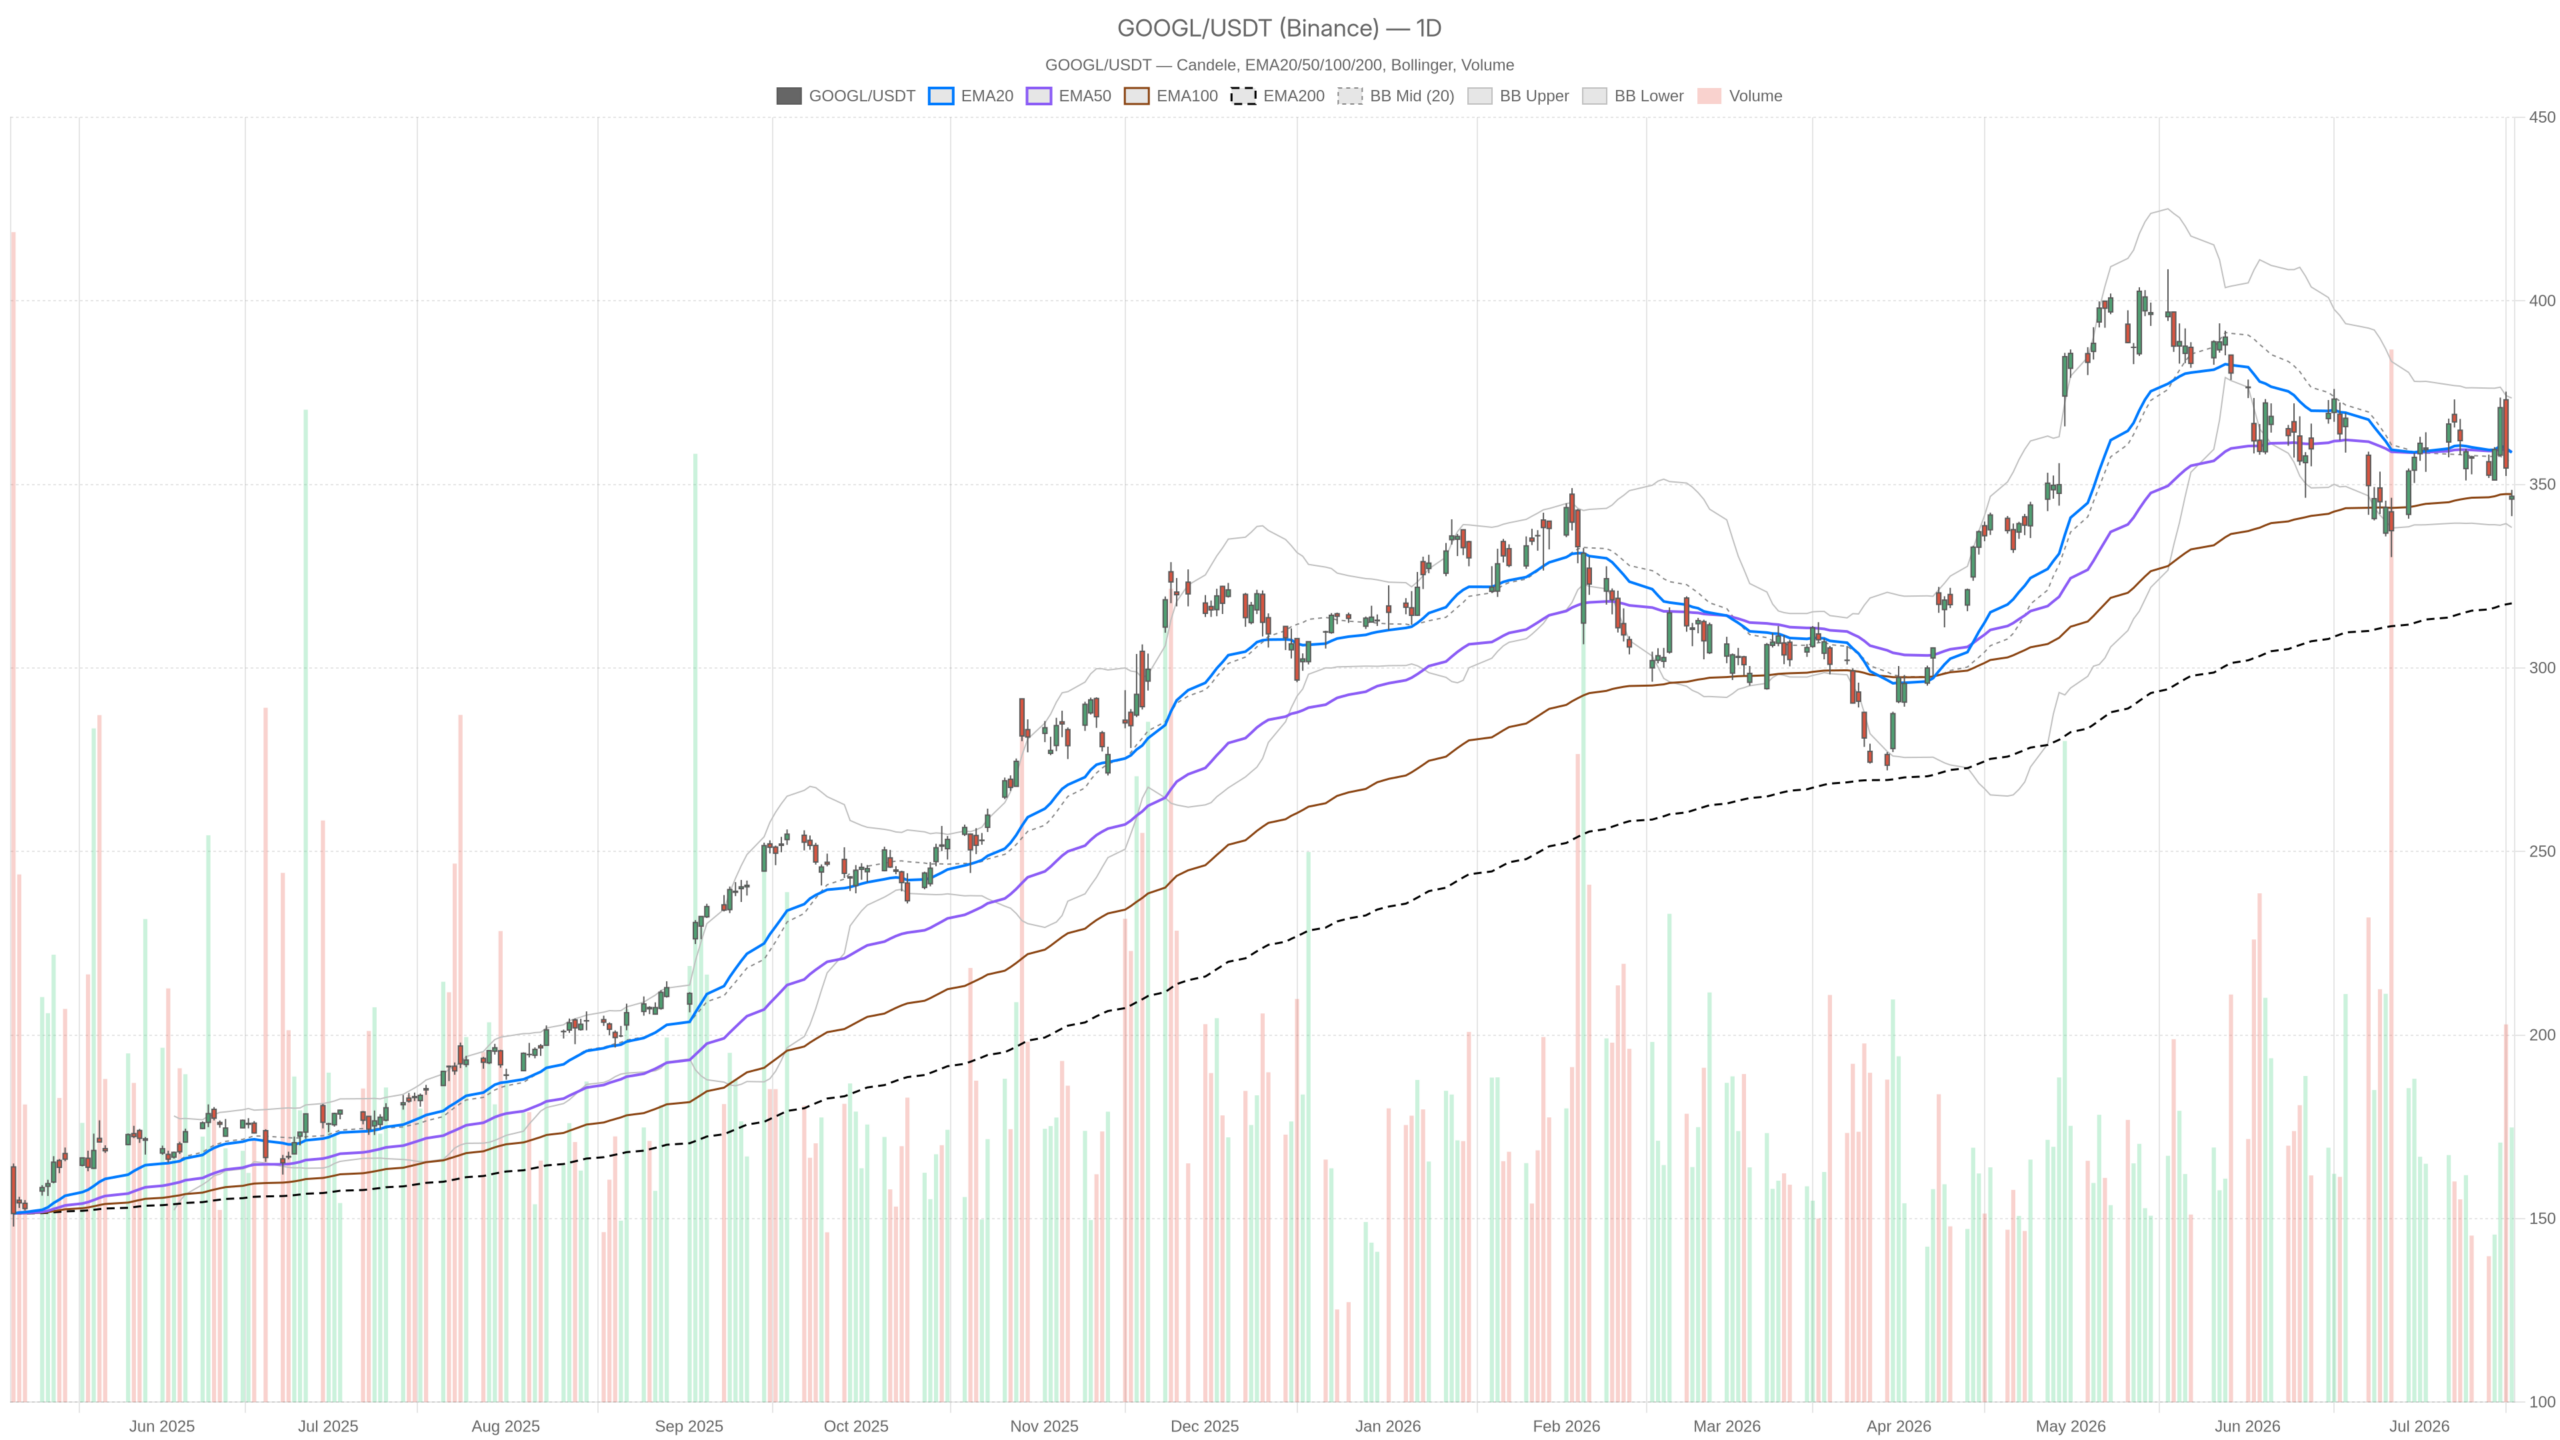
Alphabet stock is under pressure near $346.77 as GOOGL trades below its 20-day and 50-day EMAs heading into a critical investor update. Momentum indicators point south across multiple timeframes. The weight of evidence tilts bearish despite a technically neutral daily regime.
Key takeaways
- GOOGL closed at $346.77, below both the EMA20 at $358.68 and the EMA50 at $358.89.
- The hourly regime is formally bearish, with a MACD histogram of -2.19 signaling accelerating downside momentum.
- The delayed launch of Gemini 3.5 Pro — Alphabet’s most powerful AI model — is weighing on investor sentiment.
- Berkshire Hathaway holds Alphabet as a top position, providing a counterweight of institutional confidence.
- The upcoming investor update is the single most important near-term catalyst for the stock.
Daily Timeframe: A Weakening Structure for Alphabet Stock
Alphabet stock’s daily chart reveals a weakening technical structure. GOOGL trades well below its key short-term moving averages, with momentum steadily draining from the trend.
On the daily chart, price action tells a clear story of fading momentum. GOOGL closed at $346.77, sitting below its EMA20 at $358.68 and EMA50 at $358.89. Both short-term averages are essentially flat and stacked tightly together. That signals the prior trend has stalled rather than reversed cleanly.
Meanwhile, the EMA200 at $317.61 remains comfortably below price. This at least preserves the longer-term structural floor for Alphabet stock.
Momentum Indicators and Key Levels
The daily RSI at 42.23 is approaching oversold territory without quite reaching it. That level reflects weakening buying interest — but without a decisive capitulation. The MACD reinforces this: the line at -2.11 sits below the signal at -2.06. The histogram reads -0.05, barely negative but still pointing downward. No bullish crossover has emerged.
Bollinger Bands place price near the lower half of the daily range. The midline at $355.90 now acts as overhead resistance. The lower band at $338.27 defines the nearest structural support on this timeframe. Notably, the ATR at $11.07 signals that daily swings remain meaningful — a move in either direction carries real weight.
Pivot analysis adds further granularity. The daily pivot point sits at $345.55, with resistance at $349.74 and support at $342.58. GOOGL hovers just above the pivot, offering little conviction to either side.
Hourly Confirmation: The Bearish Case Deepens
The hourly chart deepens the bearish case for Alphabet stock. All three key EMAs are stacked above price in a descending resistance ceiling that any intraday bounce must work through.
The 1-hour timeframe is formally classified as bearish. Price sits at $346.62, trading below the EMA20 at $354.87, the EMA50 at $357.91, and the EMA200 at $361.89. That layered ceiling creates multiple resistance levels. Any bounce faces significant structural hurdles before the regime can shift.
Notably, the hourly RSI has dropped to 33.10 — close to oversold. This alone does not trigger a buy signal, but it suggests selling pressure may be approaching short-term exhaustion. However, the MACD on this timeframe is far more concerning. The line at -4.61 against a signal of -2.42 produces a histogram of -2.19. That wide, accelerating divergence indicates the bearish move has been gaining speed, not moderating.
In contrast to the daily chart — where the MACD histogram is nearly flat — the hourly reading shows active downside momentum. The daily may appear to be stabilizing at the surface. Underneath, intraday selling flows remain intense.
15-Minute Context: A Brief Pause, Not a Reversal
The 15-minute chart shows only a brief stabilization, not a reversal. A modest MACD crossover provides a potential short-term pause, but the regime remains firmly bearish.
At the 15-minute level, the MACD histogram has turned positive at +0.83. The line at -2.49 has crossed above the signal at -3.32. The RSI sits at 43.56 — neutral, not extended. Price closed at $346.62, near the upper end of the session’s 15-minute range.
This short-term flicker aligns with the hourly RSI nearing oversold conditions. It provides a potential entry window for nimble traders. At the same time, the 15-minute regime remains bearish, and all three EMAs on this timeframe are stacked above price. The bounce, if sustained, would need to reclaim the 15-minute EMA20 at $346.81 first — a level barely above current price. The 15-minute ATR of just $1.40 confirms any short-term move will be tight and potentially choppy.
The Narrative Behind the Numbers: AI Delays and Institutional Confidence
Two competing narratives are shaping Alphabet stock right now: AI execution concerns and enduring institutional backing. The technical picture does not exist in a vacuum.
On one side, Gemini 3.5 Pro — Alphabet’s most powerful AI model, promised for June — has still not arrived. That delay is actively spooking investors who had priced in a competitive response to rivals in the AI space. The stock is slipping, and the market is asking whether the search giant is falling behind.
On the other side, institutional confidence in Alphabet remains substantial. Berkshire Hathaway, now under Greg Abel’s leadership, holds Alphabet as one of its largest positions. Apple and Alphabet together represent nearly 30% of Berkshire’s $348 billion stock portfolio. Warren Buffett’s long-standing aversion to tech stocks makes this position all the more meaningful as a signal of fundamental conviction.
Ahead of the upcoming investor update, the key question is whether Alphabet’s management can credibly justify its massive AI capital outlays. The Motley Fool has flagged this directly — investors want answers on AI spending, not just promises. If the company delivers a compelling narrative, the technical setup could shift rapidly. If it disappoints, the existing bearish structure has room to extend toward the daily lower Bollinger Band near $338.
Bullish Scenario: What Would Change the Picture
A bullish reversal for Alphabet stock would require reclaiming the daily EMA20 at $358.68 with conviction and volume. Without this, any rally remains corrective rather than structural.
Price needs to close above the EMA20 — which aligns closely with the EMA50 at $358.89 — creating a meaningful resistance cluster. A clean close above $360 would shift the daily structure meaningfully. Meanwhile, the MACD histogram on the daily must turn positive. The hourly RSI would also need to confirm recovery rather than merely pause near oversold levels.
The catalyst most likely to trigger this is a strong investor update. If Alphabet delivers clarity on AI monetization, announces a firm Gemini 3.5 Pro launch date, or provides guidance exceeding expectations, the stock could compress the gap between current price and the EMA cluster quickly. Berkshire’s institutional backing would lend fundamental credibility to any such rebound.
Bearish Scenario: The Risks Remain Real for Alphabet Stock
The bearish case remains the path of least resistance for Alphabet stock. Downside targets sit at $342.58 and $338.27, with the hourly MACD showing no sign of a bottom yet.
Should price break below the daily pivot support at $342.58, the next meaningful level is the lower Bollinger Band at $338.27 — roughly 2.5% below current levels. A disappointing investor update, or continued silence on Gemini 3.5 Pro, would validate the selling momentum already present in the data.
In this scenario, the EMA200 at $317.61 on the daily chart represents the longer-term floor to watch. That is a significant distance from current price. The absence of any strong support between $338 and $317 means a breakdown could prove sharp rather than gradual.
Positioning Outlook: Volatility Elevated, Clarity Lacking
Alphabet stock sits at a pivotal juncture, with the technical structure favoring caution ahead of the upcoming investor update. The burden of proof remains on the bulls.
Overall, the daily regime is technically neutral, yet the hourly and 15-minute frames are both bearish. The fundamental backdrop is split between institutional conviction — anchored by Berkshire’s large position — and near-term anxiety over AI execution. The ATR of $11.07 on the daily signals that volatility is real and positions carry genuine risk in both directions.
The upcoming investor update is the single most important near-term variable. Until that catalyst resolves, the technical structure favors caution. Price remains below its key short-term averages. Momentum is negative on the dominant timeframe. The news flow is mixed. Traders should treat the 15-minute stabilization as a potential short-term opportunity — not as a structural shift.
FAQ
What is the current price of Alphabet stock and where does it stand technically?
Alphabet stock closed at $346.77 as of July 17, trading below both its 20-day EMA at $358.68 and 50-day EMA at $358.89. The daily regime is technically neutral, but the hourly and 15-minute timeframes are both formally bearish.
What is driving the bearish sentiment on Alphabet stock?
The delayed launch of Gemini 3.5 Pro — Alphabet’s most powerful AI model originally promised for June — is weighing heavily on investor sentiment. The market appears to be pricing in disappointment ahead of a critical investor update where management must justify massive AI capital outlays.
What support levels should traders watch for GOOGL?
The nearest support sits at the daily pivot level of $342.58, followed by the lower Bollinger Band at $338.27. Further down, the EMA200 at $317.61 represents the longer-term structural floor. No strong support exists between $338 and $317.
What could trigger a bullish reversal for Alphabet stock?
A strong investor update with clarity on AI monetization and a firm Gemini 3.5 Pro launch date could trigger a recovery. Price would need to reclaim the daily EMA20 at $358.68 with volume. A clean close above $360 would shift the daily structure meaningfully.
Disclaimer: This article is for informational purposes only and does not constitute financial advice, an investment recommendation, or a solicitation to buy or sell any financial instrument or cryptocurrency. The analysis provided is not indicative of future results. Investing in crypto assets and financial markets carries a high risk of capital loss. Always do your own research (DYOR) and consult a qualified financial advisor before making any decision.
Article produced with the assistance of artificial intelligence and reviewed by the editorial team.