


Enovix Corporation stock closed at $4.73, retreating from a $5.04 intraday high. The pullback leaves the daily chart defensive. Yet shorter-term action hints at a tactical bounce. This timeframe clash demands careful unpacking before conclusions about ENVX stock price direction.
Key takeaways
- Enovix Corporation stock closed at $4.73, retreating from a $5.04 intraday high, settling below the daily pivot of $4.80.
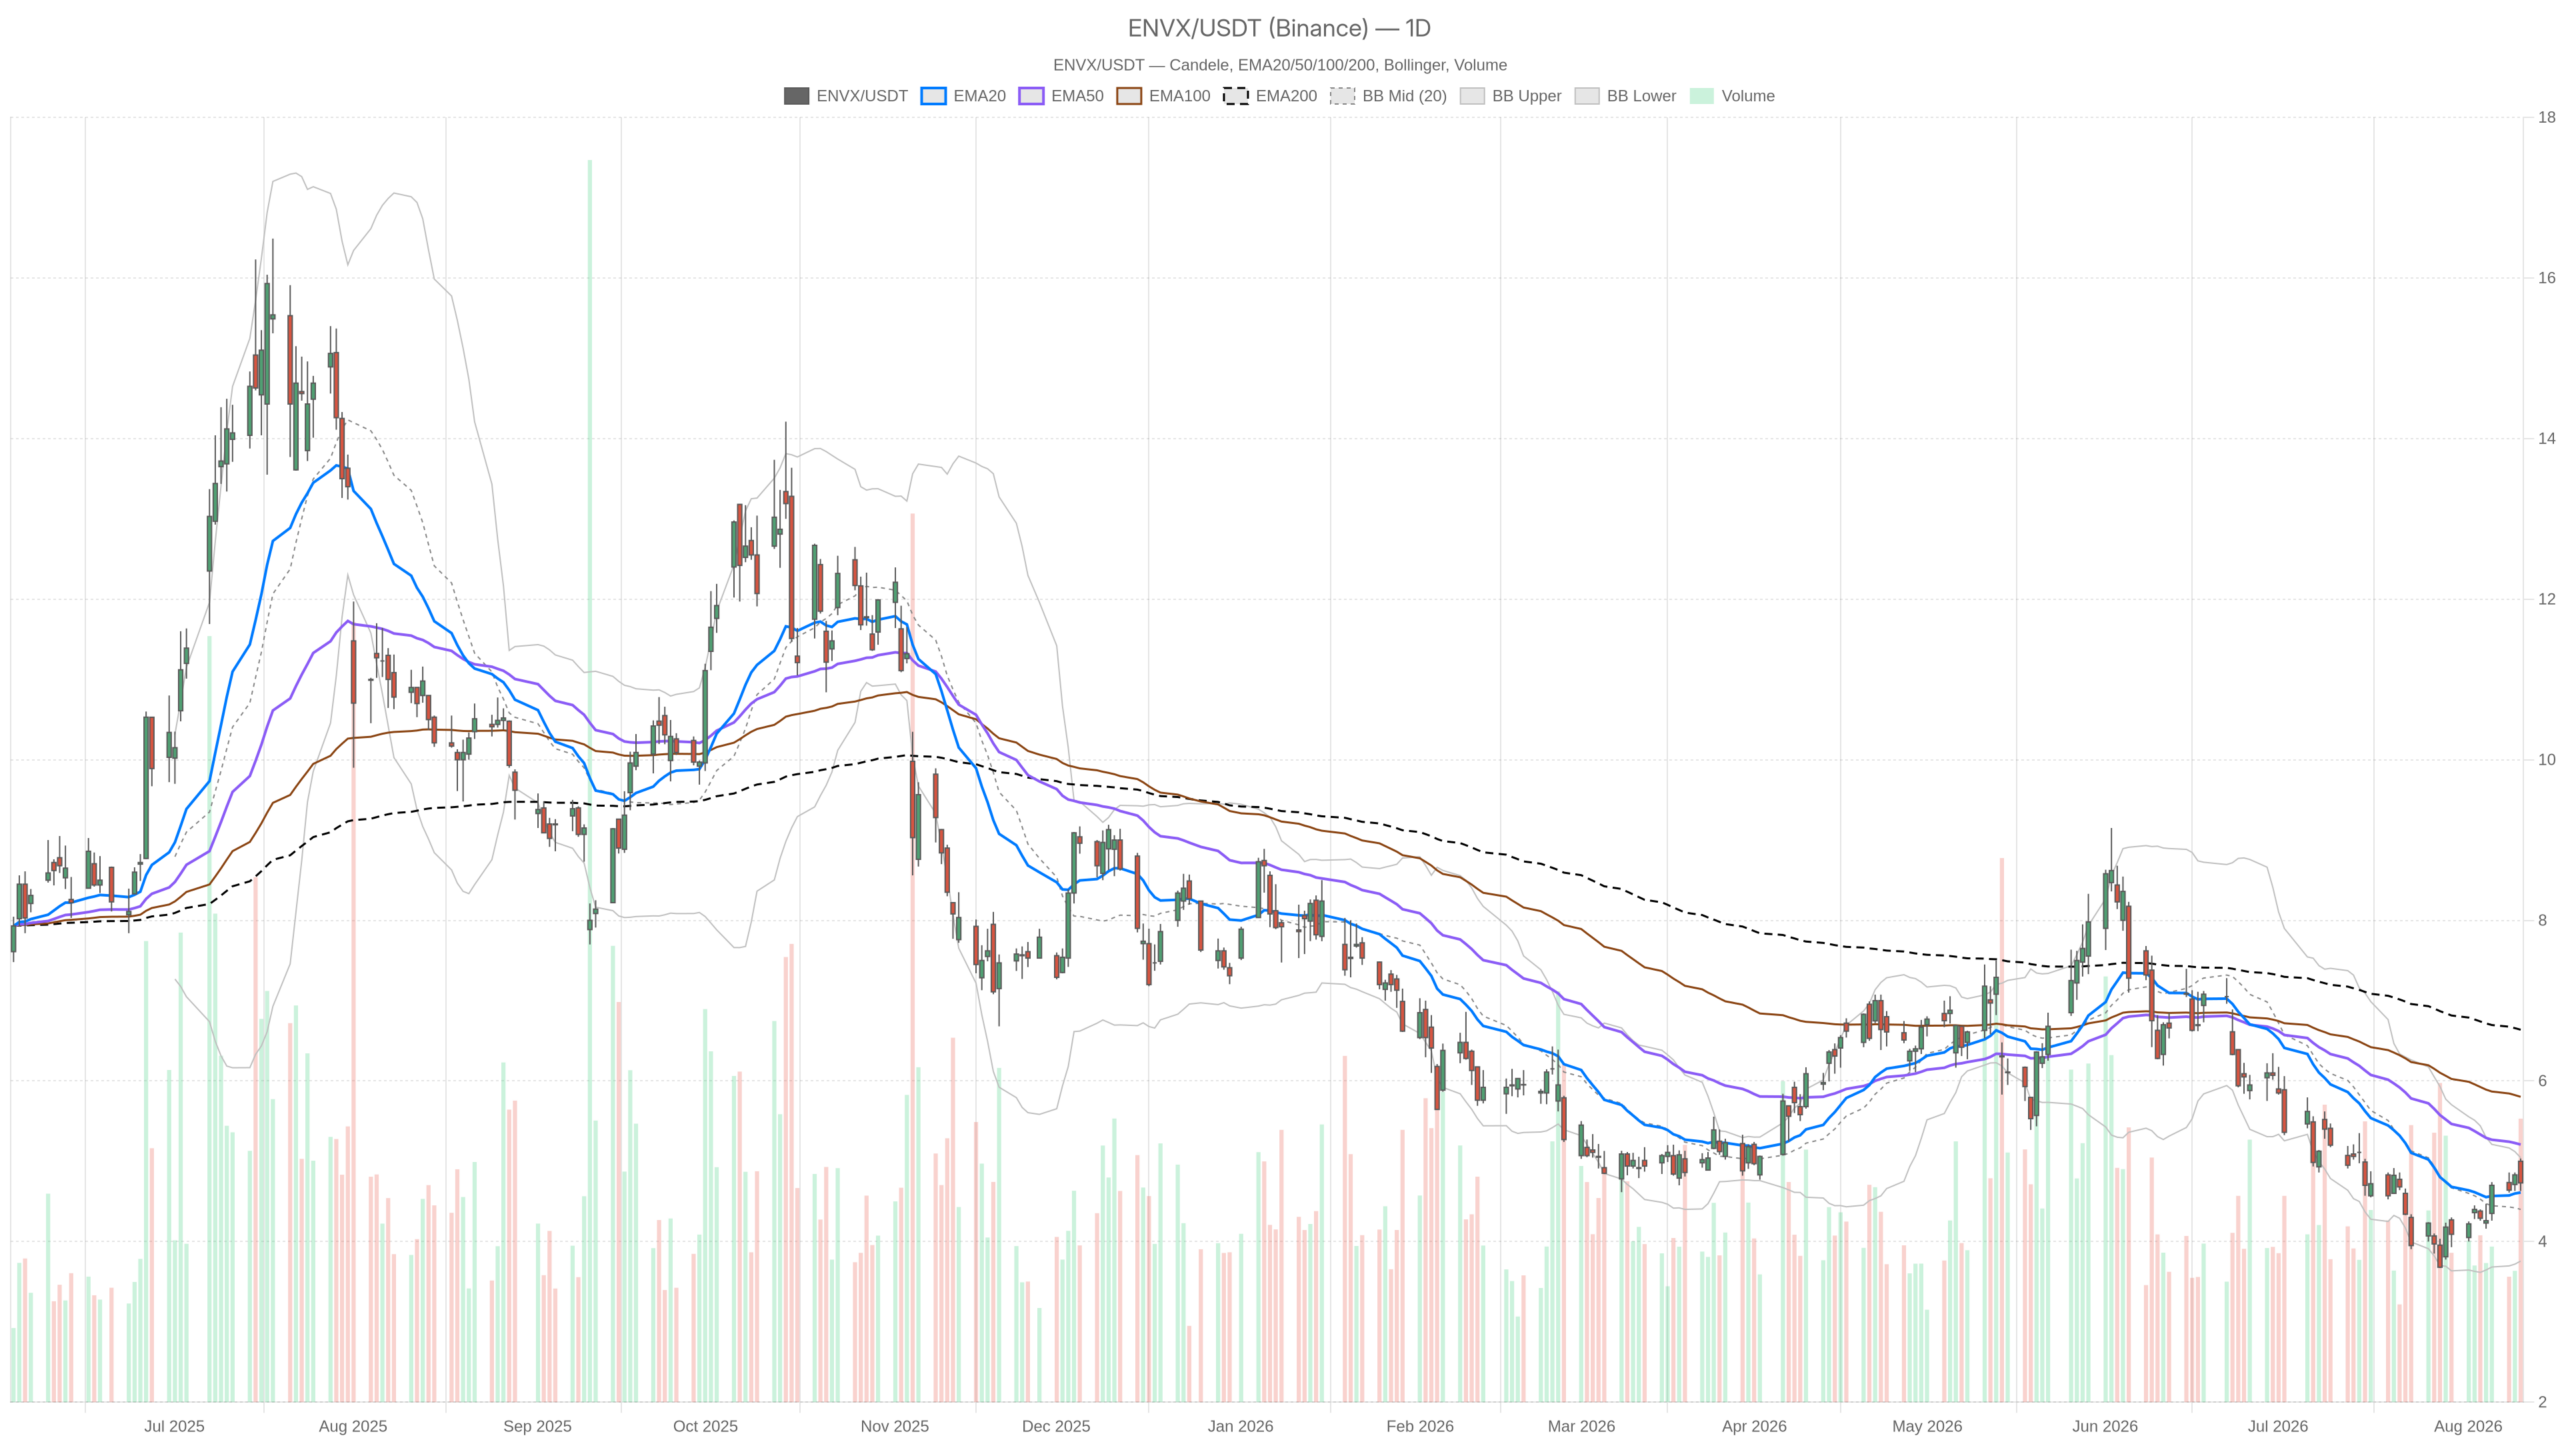
- The daily chart remains in a downtrend with the 50-day EMA at $5.21 and the 200-day EMA at $6.64 both well above current price.
- Daily RSI at 49.47 is neutral; the MACD histogram has turned positive at 0.15, signaling fading downside momentum rather than a reversal.
- The hourly bounce is losing conviction: MACD has rolled below its signal line and the hourly histogram is now negative at -0.01.
- Key resistance sits at $4.80–$4.97; failure to clear this zone would likely send price back toward $4.56 support.
Daily Chart: Downtrend Still Weighs on Enovix Corporation Stock
The daily chart confirms a downtrend. Price at $4.73 holds above the 20-day EMA at $4.61. However, it remains firmly beneath the 50-day EMA at $5.21 and the 200-day EMA at $6.64. That stacking of moving averages is the clearest signal on the chart. It describes a market that recently reclaimed short-term ground but stays embedded in a longer decline. Until price closes above the 50-day average, the structural bias remains tilted to the downside.
Momentum Indicators Signal a Pause, Not a Reversal
The daily RSI reads 49.47, essentially neutral. The reading neither confirms strength nor signals exhaustion. It simply reflects a market searching for direction after a sharp prior decline. Meanwhile, MACD tells a more nuanced story. The line sits at -0.22, below the signal line at -0.36. Yet the MACD histogram has turned positive at 0.15. Downside momentum remains technically negative but is fading. That kind of histogram divergence often precedes a pause or a modest relief attempt rather than a fresh breakdown.
Volatility and Pivot Context
Bollinger Bands on the daily chart show the midline at $4.40. The upper band sits at $5.04 and the lower band at $3.76. Price closing near the upper half of that range, after tagging the $5.04 ceiling intraday, suggests buyers made a genuine attempt to push higher before sellers stepped back in. Notably, daily ATR14 stands at $0.34. Single-session swings remain wide relative to current price. That keeps risk management non-trivial for anyone trading Enovix Corporation stock at this stage.
The daily pivot sits at $4.80, with resistance at $4.97 (R1) and support at $4.56 (S1). Friday’s close beneath the pivot but above S1 places the stock in a technically neutral pocket. It is not broken down, but it has not yet reclaimed control either.
Hourly Chart: The ENVX Bounce Is Losing Conviction
The hourly chart shows a bounce that is losing momentum right as it approaches resistance. Price at $4.75 sits above both the 20-hour EMA ($4.72) and the 50-hour EMA ($4.57). It trades right at the 200-hour EMA of $4.77. This alignment reflects a short-term uptrend attempting to establish itself within the larger daily downtrend. In short, it is a classic countertrend bounce setup.
RSI on the hourly chart reads 55.38. That is mildly bullish and consistent with the recent grind higher. However, MACD is starting to roll over. The line at 0.07 has slipped just under the signal at 0.09. The histogram has turned negative at -0.01. In other words, momentum on this timeframe is decelerating even as price holds up. That creates a meaningful conflict with the daily setup, where momentum was improving rather than fading.
At the same time, hourly Bollinger Bands have the midline at $4.73, right where price is trading. The upper band sits at $4.88 and the lower band at $4.59. The stock is essentially parked at the middle of its short-term range, waiting for a catalyst. Hourly ATR14 is a tighter $0.10. The hourly pivot at $4.72, with resistance at $4.81 and support at $4.66, frames a narrow battleground for the next few sessions.
15-Minute View: Execution Context Only
Zooming into the 15-minute chart, price at $4.75 trades just below the 20-period EMA ($4.78) and the 50-period EMA ($4.76). It sits well above the 200-period EMA at $4.53. This configuration points to a short-term pause or mild pullback within the broader intraday bounce. The picture does not signal a clean continuation higher.
RSI15 at 45.42 leans slightly bearish. MACD is flat-to-negative, with the line at -0.01 versus a signal of 0.01. Bollinger Bands show price closer to the lower band ($4.72) than the upper ($4.87). This reinforces the sense of near-term hesitation. For traders using this window purely for timing, the intraday bounce is losing energy right at resistance. That matters for entries but does not override the higher timeframe picture.
Bullish Scenario for Enovix Corporation Stock
A constructive path forward requires clearing the $4.80–$4.97 resistance zone. Price must push through the daily pivot at $4.80 and then R1 at $4.97, ideally on rising volume above the recent 8.8 million shares traded. Reclaiming the 50-day EMA at $5.21 would be the more decisive signal. It would confirm that the hourly bounce has real follow-through rather than fading at resistance. If the hourly MACD histogram flips back positive alongside that move, it would support the idea that momentum is genuinely turning rather than just stalling within a larger downtrend.
Bearish Scenario: What Would Invalidate the Bounce
In contrast, a rejection near the $4.80–$4.88 zone would favor sellers. This is where the daily pivot, hourly resistance, and hourly upper Bollinger Band all cluster. A break below the daily EMA20 at $4.61 and S1 at $4.56 would put the lower Bollinger Band near $3.76 back in play. That would effectively erase the recent bounce. Price remains far below both the 50-day and 200-day EMAs. Any loss of the current support cluster would reaffirm that the primary downtrend never actually reversed.
Positioning and Volatility Outlook
Overall, Enovix Corporation stock sits at a technically balanced but fragile point. The daily chart still reflects a downtrend that has not been repaired. The hourly chart shows a bounce that is losing momentum right as it approaches resistance. Meanwhile, the 15-minute picture suggests near-term hesitation rather than conviction in either direction. With daily ATR at $0.34 and hourly ATR at just $0.10, volatility is meaningfully higher on longer timeframes. This argues for caution around position sizing. Until price decisively clears the $4.80–$4.97 zone or breaks below $4.56, the setup remains genuinely two-sided. Traders should treat the current stage as a decision zone rather than a confirmed trend continuation.
FAQ
Is Enovix Corporation stock in a downtrend or an uptrend?
The daily chart shows a downtrend. Price at $4.73 sits below both the 50-day EMA ($5.21) and the 200-day EMA ($6.64), confirming a bearish structural bias. The 20-day EMA at $4.61 provides near-term support but does not change the broader trend direction.
What would confirm a bullish reversal in ENVX stock?
A bullish reversal would require price to clear the $4.80–$4.97 resistance zone on rising volume. It would then need a close above the 50-day EMA at $5.21. A return to a positive hourly MACD histogram would add conviction to such a move.
What are the key support levels for Enovix Corporation stock?
Immediate support sits at the daily EMA20 of $4.61 and S1 at $4.56. Below that, the daily lower Bollinger Band near $3.76 becomes the next major support level.
Disclaimer: This article is for informational purposes only and does not constitute financial advice, an investment recommendation, or a solicitation to buy or sell any financial instrument or cryptocurrency. The analysis provided is not indicative of future results. Investing in crypto assets and financial markets carries a high risk of capital loss. Always do your own research (DYOR) and consult a qualified financial advisor before making any decision.
Article produced with the assistance of artificial intelligence and reviewed by the editorial team.