


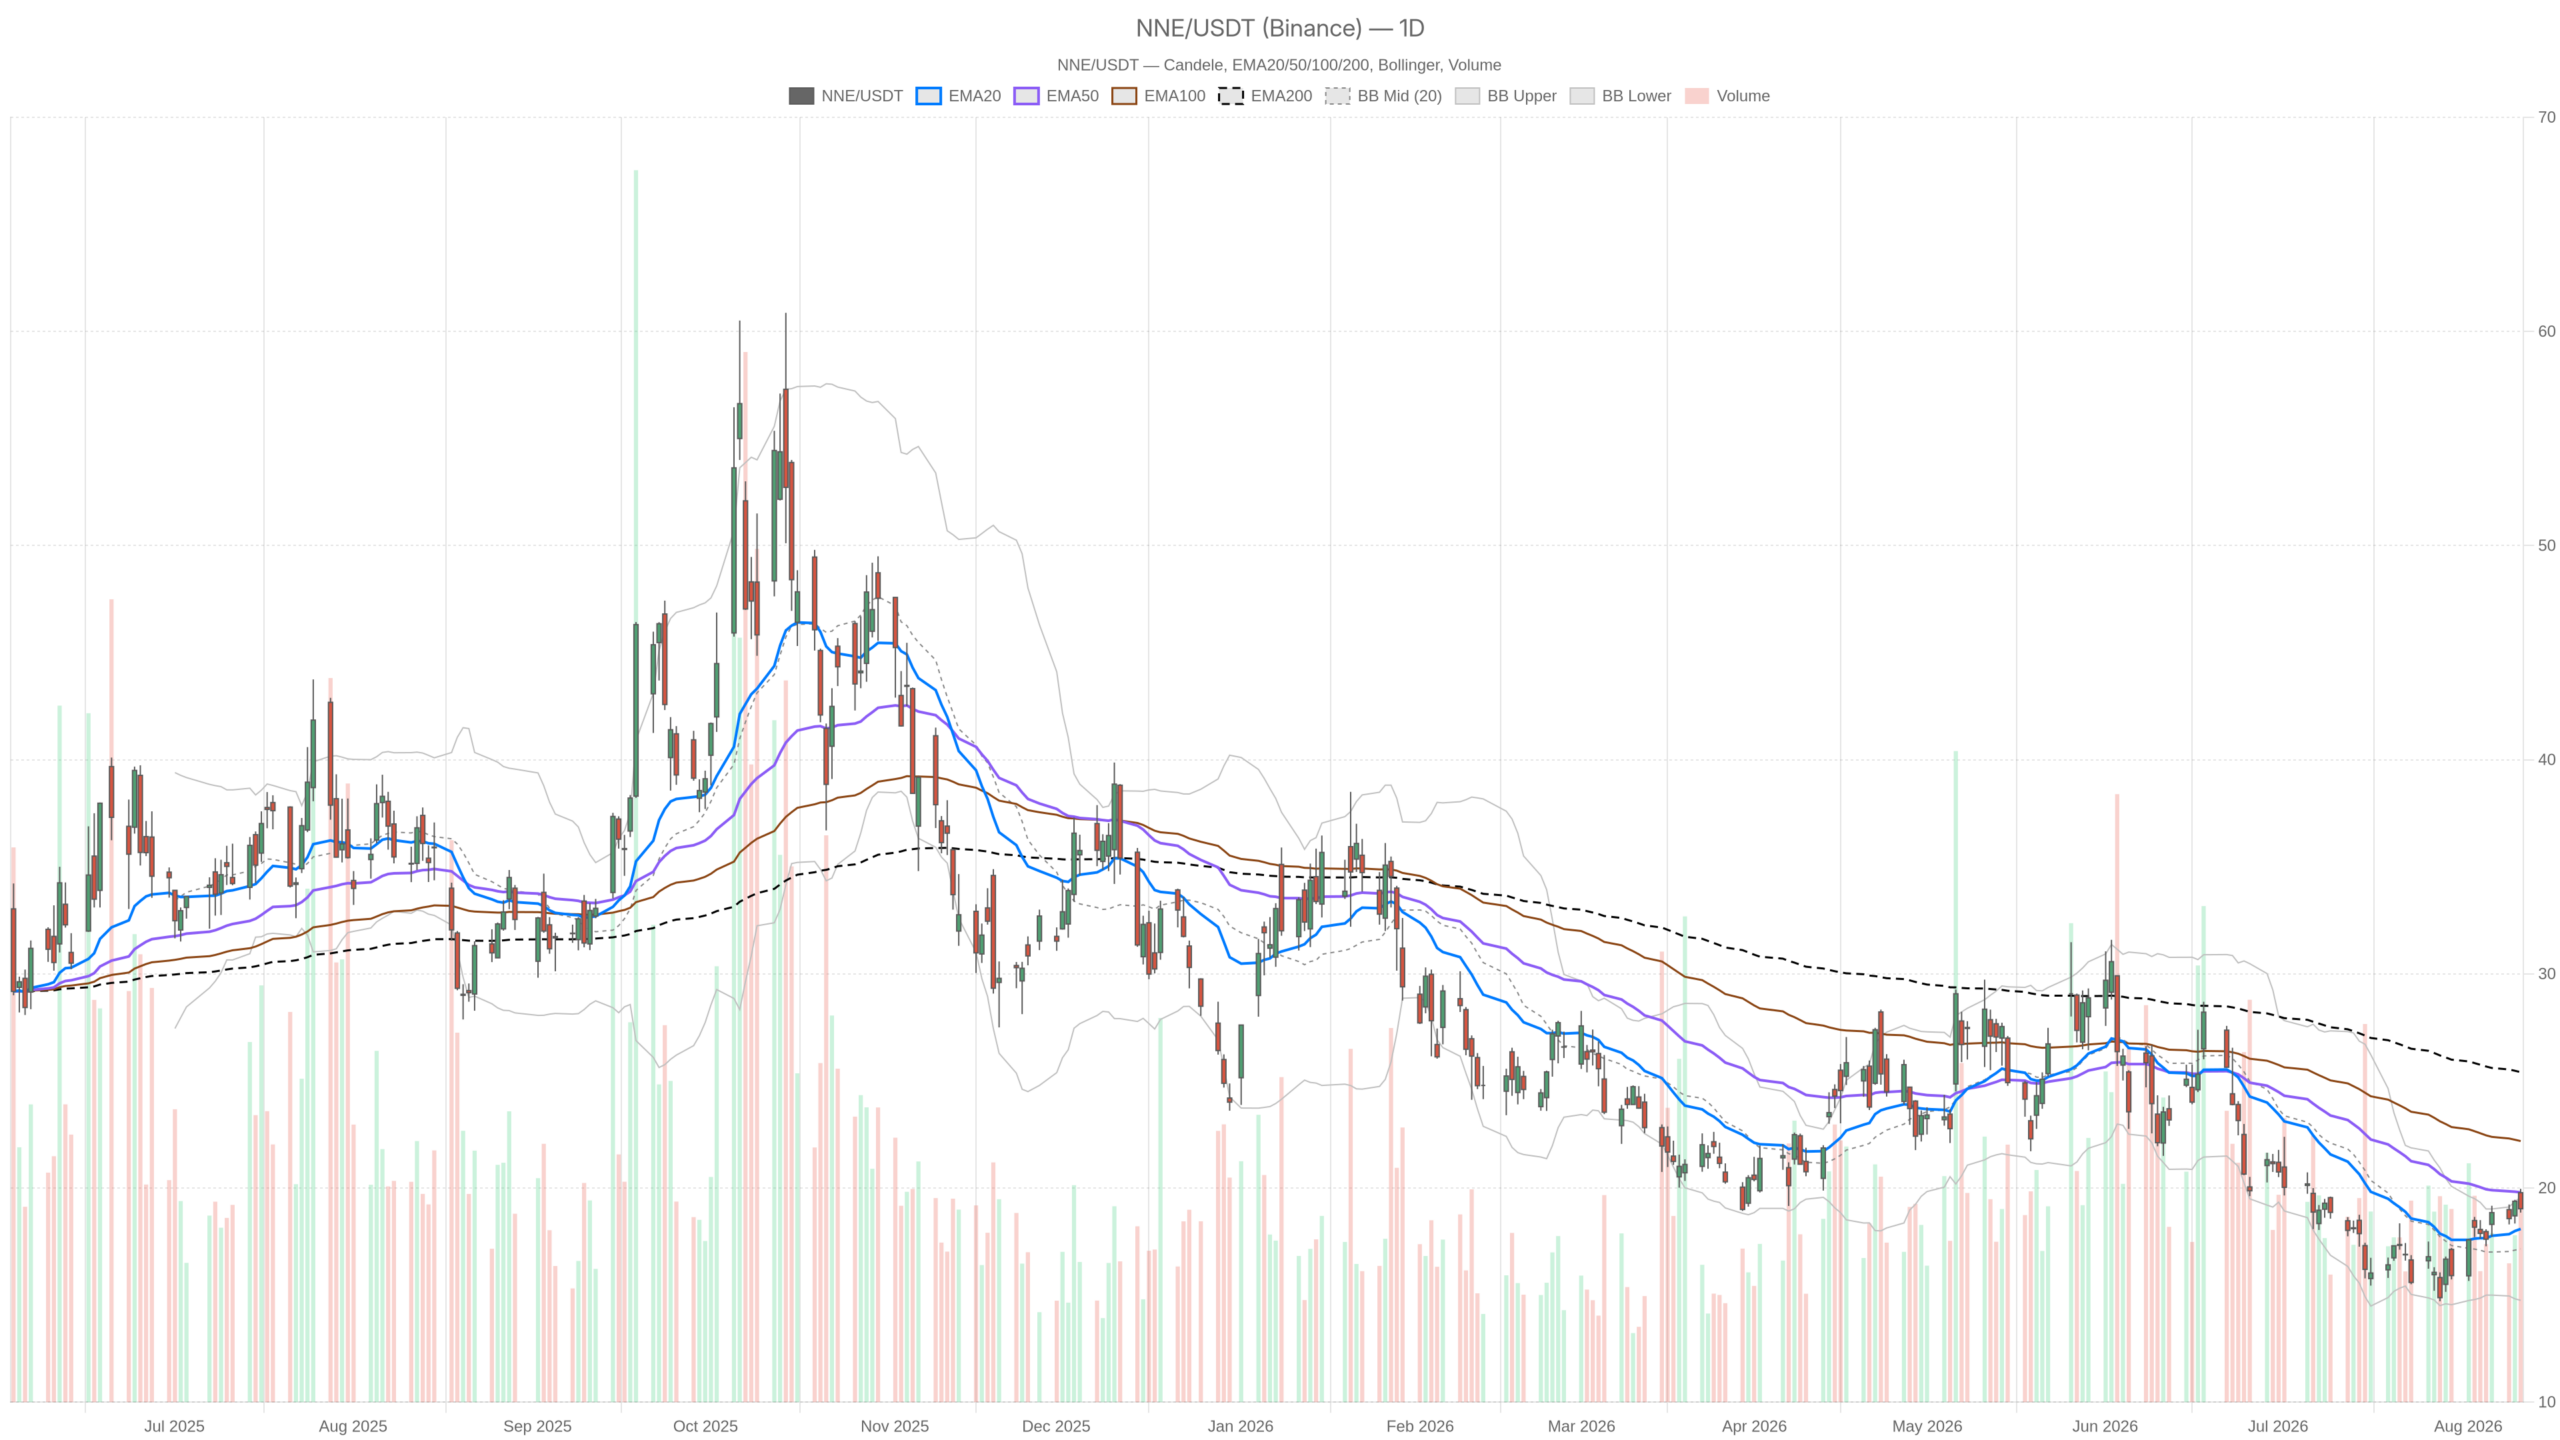
Nano Nuclear Energy Inc. stock closed at $19.03, holding just below the $19.28 pivot. Shares sit above the 20-day EMA at $18.09 but remain below the 50-day EMA at $19.80 and the 200-day EMA at $25.41. The stock is stabilizing inside a larger downtrend — not reversing it.
Key takeaways
- NNE closed at $19.03, between the 20-day EMA ($18.09) and the 50-day EMA ($19.80).
- Daily RSI14 at 52.89 signals neutral momentum — selling has paused but upside conviction is absent.
- The hourly chart shows bullish EMA alignment, yet the MACD histogram has flipped slightly negative.
- Daily ATR14 at 1.36 indicates elevated volatility, with $1+ daily swings considered normal.
- The $18.60 to $19.71 range is likely to decide whether the recovery extends or fades.
Daily Trend: A Recovery Attempt Inside a Larger Downtrend
Nano Nuclear Energy Inc. stock is attempting to stabilize, but the daily chart confirms it remains inside a larger downtrend. Price holds above the 20-day EMA yet sits well below both the 50-day and 200-day averages.
EMA Structure Confirms the Broader Downtrend
The gap between the 20-day EMA and the 200-day EMA tells the real story. A 200-day average sitting more than six dollars above the current price is not a minor technical detail — it is a structural headwind. Meanwhile, the shorter 20-day average has curled up beneath price. This marks the first sign of stabilization after a decline. However, it is far from confirmation of a trend change.
Momentum and Volatility Signals
The daily RSI14 reads 52.89, essentially neutral. It reflects a market that has stopped falling without building real upside conviction. The MACD picture is more nuanced. The MACD line at -0.29 sits against a signal line of -0.84, producing a positive MACD histogram of 0.55. That histogram expansion shows momentum improving from a negative base — a constructive development. Still, both the MACD line and signal line remain below zero. The broader momentum trend is technically negative.
Bollinger Bands add another layer. The daily mid-band sits at $17.16. The upper band is at $19.56 and the lower band at $14.75. Price closed near the upper band after bouncing off levels closer to the lower band in recent sessions. This kind of move — from lower band toward upper band — usually reflects a genuine short-term squeeze higher. At the same time, it also means the stock is now pressing against resistance rather than sitting in cheap territory.
Daily ATR14 stands at 1.36, a meaningful chunk of the current price. This is not a low-volatility name. Traders sizing positions in NNE need to respect that swings of more than a dollar in a single session are within normal range. The daily regime reading is labeled neutral, consistent with a stock in transition rather than a confirmed trend.
Hourly Chart: Short-Term Strength With Fading Momentum
The hourly chart paints a different picture — one of short-term bullish structure with early signs of momentum fatigue. The EMA alignment is cleanly bullish, but the MACD histogram has turned slightly negative.
Here is where the timeframes start to disagree. On the 1-hour chart, the regime flips to bullish. Price at $19.03 sits above the 20-hour EMA at $18.96. That sits above the 50-hour EMA at $18.41. The 50-hour, in turn, sits above the 200-hour EMA at $18.33. This is a clean, stacked bullish alignment across all three moving averages. It is a structure that looks nothing like the daily chart’s longer-term downtrend.
Hourly RSI14 at 55.74 supports that reading, showing mild bullish momentum without stretching into overbought territory. However, the hourly MACD is losing steam. The MACD line at 0.25 is barely above its signal line at 0.28. The histogram has flipped slightly negative at -0.02. That is a subtle but real warning sign: intraday momentum is flattening even as the broader hourly structure remains technically bullish.
Therefore, the conflict between timeframes is worth stating plainly. The daily chart shows a stock still working against a heavy longer-term downtrend with neutral momentum. Meanwhile, the hourly chart shows short-term bullish structure with fading momentum. Neither view cancels the other out. Together they describe a stock attempting a recovery that has not yet proven durable beyond the immediate session.
15-Minute Chart: Short-Term Pullback Within a Bullish Structure
The 15-minute chart points to a short-term pullback unfolding within the broader hourly uptrend, rather than a reversal signal.
On the 15-minute chart, the picture leans cautious. Price at $19.03 trades below both the 20-period EMA at $19.21 and the 50-period EMA at $19.07. However, it remains above the 200-period EMA at $18.30. RSI14 has slipped to 41.87, and the MACD histogram is modestly negative at -0.04. Overall, this points to a short-term pullback within the broader hourly uptrend structure.
In practical terms, the 15-minute pivot at $18.99 frames the immediate battleground. Resistance sits at $19.13 and support at $18.89. A reclaim above $19.13 would tilt short-term momentum back toward the bulls. Conversely, a break below $18.89 would extend the current pullback and test how firm the hourly bullish structure really is.
Bullish Scenario for Nano Nuclear Energy Inc. Stock
For the bullish case to gain traction, Nano Nuclear Energy Inc. stock must reclaim the $19.28 pivot and push through $19.71 resistance with conviction.
Buyers need to defend the daily pivot zone around $19.28 and push through the daily resistance at $19.71. A close above the upper Bollinger Band near $19.56 on strong volume would be a meaningful signal. This would be particularly significant if the daily MACD histogram continues to expand. On the hourly chart, bulls would want to see the MACD line reclaim clear separation above its signal line. That would confirm the current flattening is temporary rather than the start of a stall. Notably, sustained trade above the 50-day EMA at $19.80 would be the next real test, since that level has capped price on the daily chart.
Bearish Scenario: What Would Invalidate the Recovery
The bearish case is straightforward: a failure to hold $18.60 support would put the recovery in serious doubt and likely reopen the path toward lower levels.
Given how far price sits below the 200-day EMA, the downside risk is structural. A break below the daily support at $18.60 would put the recent bounce in serious doubt. If price also falls below the hourly 200-period EMA near $18.33, that would undo the clean bullish EMA alignment currently supporting the short-term structure. In that scenario, the daily chart’s neutral-to-negative momentum backdrop would reassert itself. The MACD line remains below zero. Price remains under the 50-day and 200-day EMAs. The stock would likely revisit levels closer to the lower daily Bollinger Band near $14.75 over time.
Outlook: An Inflection Point Across Timeframes
Nano Nuclear Energy Inc. stock is at a genuine inflection point, with conflicting signals across daily, hourly, and 15-minute timeframes.
The daily chart shows a stabilization attempt inside a larger downtrend, supported by neutral RSI and improving but still negative MACD momentum. Meanwhile, the hourly chart shows a cleaner bullish structure that is nonetheless losing some steam. The 15-minute chart reflects a short-term pullback that has not yet broken the broader intraday uptrend. With daily ATR near 1.36, volatility remains elevated. The next few sessions around the $18.60 to $19.71 range are likely to determine whether this recovery extends or fades back into the dominant longer-term downtrend.
FAQ
Is Nano Nuclear Energy Inc. stock in an uptrend or downtrend?
On the daily chart, NNE remains in a larger downtrend. Price sits below both the 50-day EMA at $19.80 and the 200-day EMA at $25.41. However, the hourly chart shows a short-term bullish structure with stacked EMA alignment.
What are the key levels to watch for Nano Nuclear Energy Inc. stock?
Key resistance levels are $19.28 (daily pivot), $19.56 (upper Bollinger Band), $19.71 (daily resistance), and $19.80 (50-day EMA). Key support levels are $18.60 (daily support) and $18.33 (hourly 200-period EMA).
What does the RSI indicate for NNE?
The daily RSI14 at 52.89 is neutral — neither oversold nor overbought. It signals that selling pressure has eased but upside conviction has not yet emerged.
How volatile is Nano Nuclear Energy Inc. stock?
Daily ATR14 stands at 1.36, meaning swings of more than a dollar per session are within normal range. This is not a low-volatility stock, and traders should size positions accordingly.
Disclaimer: This article is for informational purposes only and does not constitute financial advice, an investment recommendation, or a solicitation to buy or sell any financial instrument or cryptocurrency. The analysis provided is not indicative of future results. Investing in crypto assets and financial markets carries a high risk of capital loss. Always do your own research (DYOR) and consult a qualified financial advisor before making any decision.
Article produced with the assistance of artificial intelligence and reviewed by the editorial team.