



Palo Alto Networks, Inc. stock closed at $362.09 after a volatile session. The company beat Q4 FY26 earnings and raised its FY27 outlook, yet the stock pulled back sharply. Escalating Middle East tensions and rising bond yields overshadowed strong fundamentals. This divergence between fundamentals and price action defines the current setup.
Key takeaways
- PANW beat Q4 FY26 earnings estimates and raised its fiscal 2027 profit outlook
- Palo Alto Networks, Inc. stock closed at $362.09, pulling back sharply despite the beat
- The daily EMA stack confirms a long-term bullish trend structure
- RSI14 at 51.47 is neutral; MACD histogram is negative at -1.29, signaling fading momentum
- The 1H timeframe shows price below EMA20 and EMA50, confirming near-term weakness
Daily Trend Remains Bullish, But Momentum Is Cooling
Palo Alto Networks, Inc. stock maintains a firmly bullish daily trend, though momentum indicators now show clear signs of cooling.
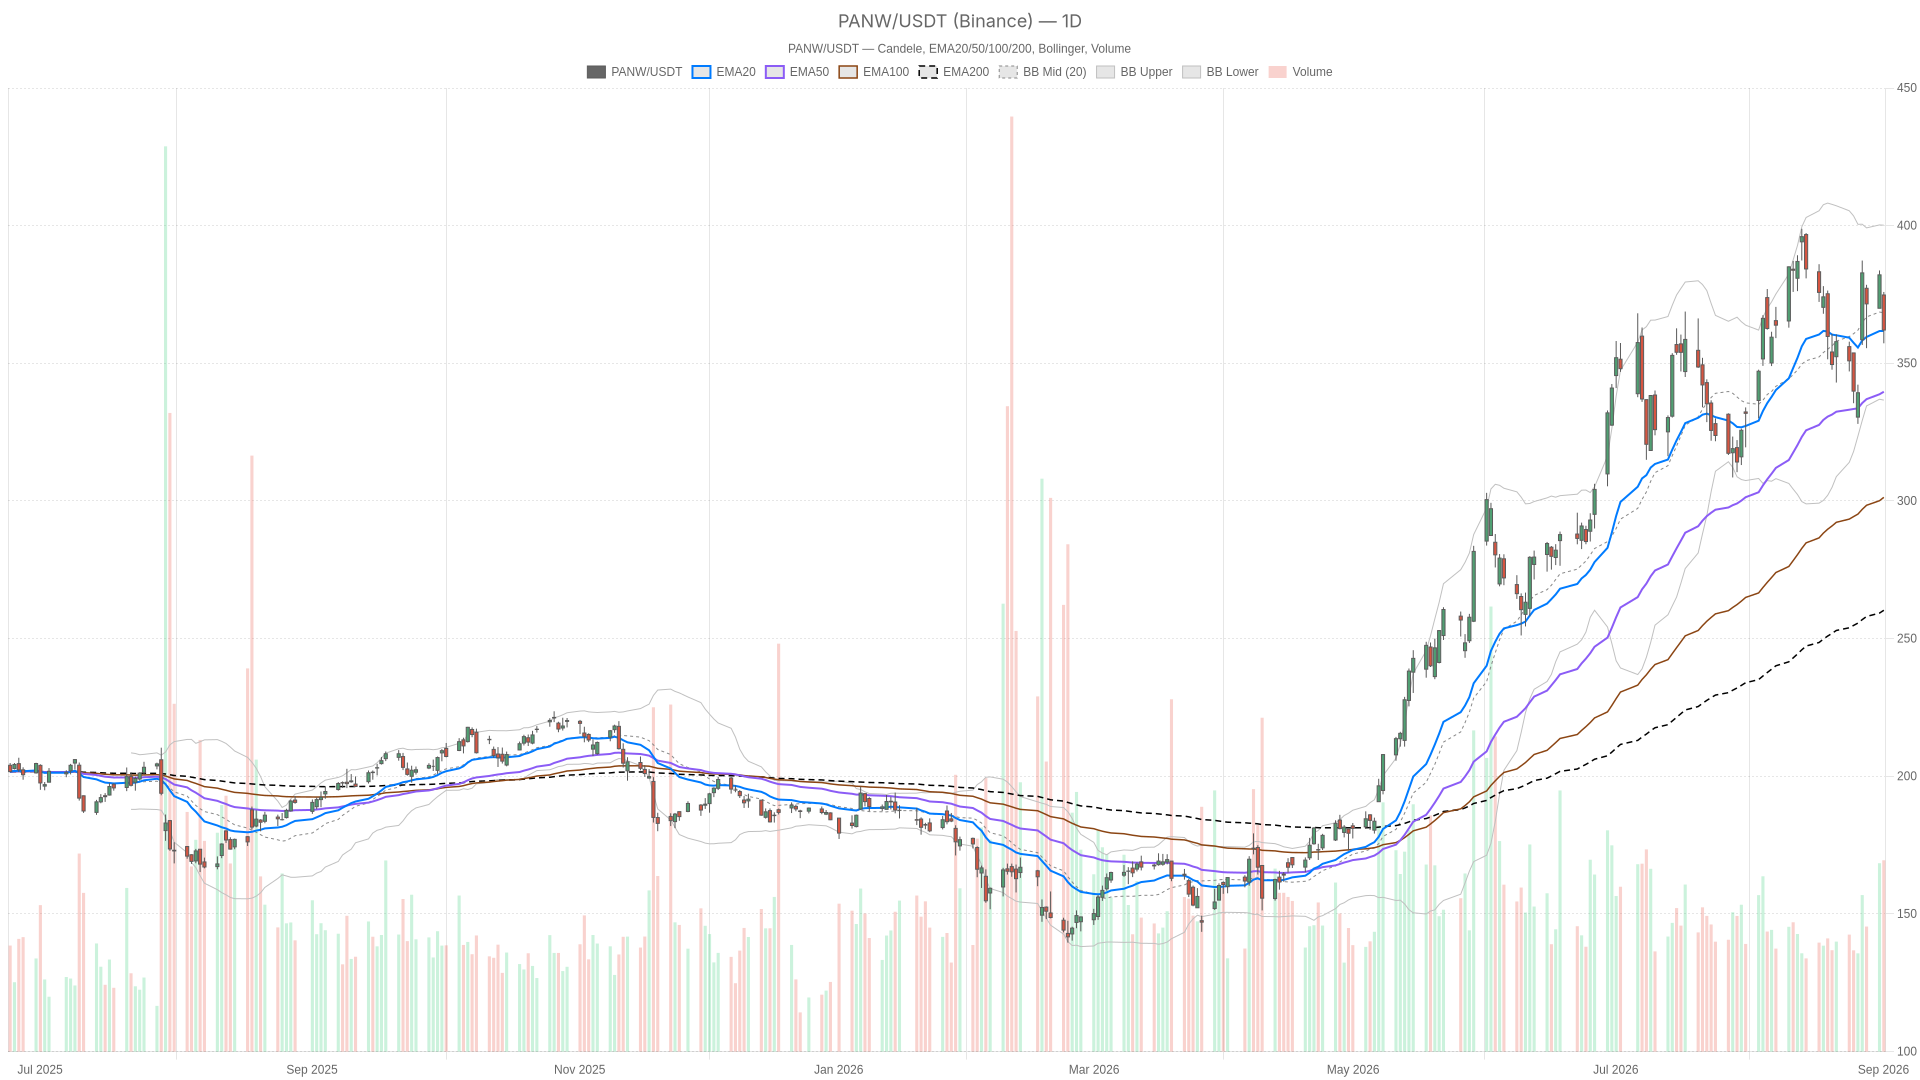
The daily chart shows PANW closing at 362.09 after opening at 374.82 and printing a high of 375.92. That is a wide range day, closing well off the top and only modestly above the 357.27 low. For a stock that beat earnings and raised guidance, this kind of candle is notable. It suggests the initial optimism was sold into, likely because of macro pressures rather than anything company-specific.
Zooming out, the primary trend on the daily timeframe is still unmistakably bullish. Price sits at 362.09, comfortably above the EMA20 at 361.76, the EMA50 at 339.67, and dramatically above the EMA200 at 260.30. That stacked EMA structure is a textbook long-term uptrend, and the system’s regime classification confirms it as bullish. However, the RSI14 at 51.47 is essentially neutral, offering no strong directional conviction.
More telling is the MACD picture. The MACD line at 6.28 sits below its signal line at 7.57, producing a negative histogram reading of -1.29. In practical terms, momentum is fading even though the broader trend structure remains intact.
Meanwhile, Bollinger Bands show price at 362.09, below the midline of 368.40 and well inside the 336.63–400.17 range. This leaves room to move in either direction without signaling exhaustion. The ATR14 reading of 18.92 confirms that volatility is elevated, consistent with the earnings-driven whipsaw seen in this session.
On the daily pivot front, the pivot point sits at 365.09, with resistance at 372.92 and support at 354.27. Price closing below the pivot and near support is a mild short-term warning sign, even within a broader uptrend.
1H Timeframe Confirms Near-Term Weakness
The hourly chart confirms genuine near-term weakness, with the stock trading below both the EMA20 and EMA50 after the earnings-driven pullback.
The hourly chart adds weight to the idea that this is a genuine near-term pullback rather than noise. At 362.25, price is trading below both the EMA20 at 366.47 and EMA50 at 364.54. However, it remains above the EMA200 at 359.12. In other words, the short-term trend has turned soft, but the intermediate structure has not broken down entirely.
RSI14 on the 1H frame reads 45.54, slightly below the neutral 50 line. This reinforces the sense of fading momentum. The MACD line at -0.85 sits well below its signal at 1.58, producing a histogram of -2.43. That is a clearer bearish signal than what appears on the daily.
Therefore, the hourly timeframe is not confirming the daily bullish regime outright. Short-term sellers currently have the upper hand even as the bigger trend stays intact. The regime here is classified as neutral, fitting the tug-of-war between trend and momentum.
Bollinger Bands on the 1H chart show the midline at 369.67, with bands stretching from 353.86 to 385.47. Price at 362.25 sits below the midline, consistent with the recent pullback. The ATR14 at 5.31 confirms that intraday volatility has picked up meaningfully following the earnings release. Pivot levels — pp at 361.05, r1 at 363.48, s1 at 359.82 — put price right in the middle of a tight, contested zone.
15-Minute Execution Context
On the 15-minute execution timeframe, the stock shows tentative signs of stabilization within a still-corrective intraday structure.
On the execution timeframe, there are early signs of stabilization. Price at 362.25 is above the 15m EMA20 of 361.51 but below both the EMA50 at 365.65 and EMA200 at 364.28. This suggests a short-term bounce attempt within a still-corrective structure. RSI14 at 48.12 remains neutral, offering no strong signal either way.
Notably, the MACD histogram on the 15m chart has flipped positive at 0.77. This occurred even though the MACD line at -2.32 remains below the signal line at -3.09. This kind of early histogram improvement often precedes a short-term relief move. However, it does not yet confirm a trend reversal.
Bollinger Bands here are tight. Price at 362.25 presses against the upper band of 362.10, while the lower band sits at 357.60. This signals that short-term buyers are testing resistance after the drop. Pivot support at 360.35 and resistance at 363.22 frame the immediate battleground for intraday traders.
Bullish Scenario
The bullish case for PANW hinges on the daily uptrend reasserting itself after this macro-driven pullback proves temporary.
For bulls, the case rests on the daily uptrend reasserting itself. A hold above the daily EMA20 near 361.76 would be the first step. A reclaim of the daily pivot at 365.09, followed by the r1 resistance at 372.92, would strengthen the case. It would suggest the pullback was simply a reaction to macro noise rather than a shift in trend.
Support at the daily s1 level of 354.27 is the line in the sand. Holding above it while RSI stabilizes back above 50 across timeframes would strengthen the bullish case considerably. Fundamentally, the raised FY27 outlook and strong AI security demand provide a supportive backdrop that could help absorb further macro-driven volatility.
Bearish Scenario
The bearish case would unfold if Palo Alto Networks, Inc. stock breaks below key support at $354.27, opening the door to a deeper correction.
A break below the daily s1 support at $354.27 would open the door to a deeper correction. This is especially true given the elevated ATR14 reading of 18.92, which implies daily swings of nearly $19 are currently normal. A failure to hold the 1H EMA200 at 359.12 would also be a warning sign. It could drag price toward the lower Bollinger Band levels on both the daily chart at 336.63 and the 1H chart at 353.86.
In this scenario, the negative MACD histogram readings across the daily and 1H timeframes would likely deepen. This would confirm that momentum has genuinely turned against the longer-term uptrend rather than just pausing.
Closing Take on Palo Alto Networks, Inc. Stock
Palo Alto Networks, Inc. stock sits at a crossroads between a firmly bullish long-term trend and clearly cooling near-term momentum.
The long-term trend remains firmly bullish. The fundamental backdrop — a beat-and-raise quarter, strengthened FY27 guidance, and the strategic Console acquisition for agentic AI — is genuinely constructive.
At the same time, near-term momentum has clearly cooled. The hourly timeframe is flagging real weakness that should not be ignored. Given elevated volatility following this earnings reaction and broader macro pressures, positioning around current levels calls for caution rather than conviction.
The next few sessions should offer more clarity. How price behaves around the daily pivot and s1 support will reveal whether this is a healthy pause in an uptrend or the start of something more consequential.
FAQ
Did Palo Alto Networks beat earnings?
Yes, the company beat Q4 FY26 earnings estimates and raised its fiscal 2027 profit outlook, while also announcing the acquisition of Console to strengthen its agentic AI security capabilities.
Why did Palo Alto Networks, Inc. stock fall despite the earnings beat?
The stock was dragged down by macro pressures, including escalating Middle East tensions and rising global bond yields, which pushed investors toward risk-off positioning and overshadowed the strong company-specific news.
What are the key support levels for PANW?
Key support sits at the daily s1 level of $354.27, with the 1H EMA200 at $359.12 also serving as important near-term support. The lower daily Bollinger Band sits at $336.63.
Disclaimer: This article is for informational purposes only and does not constitute financial advice, an investment recommendation, or a solicitation to buy or sell any financial instrument or cryptocurrency. The analysis provided is not indicative of future results. Investing in crypto assets and financial markets carries a high risk of capital loss. Always do your own research (DYOR) and consult a qualified financial advisor before making any decision.
Article produced with the assistance of artificial intelligence and reviewed by the editorial team.