



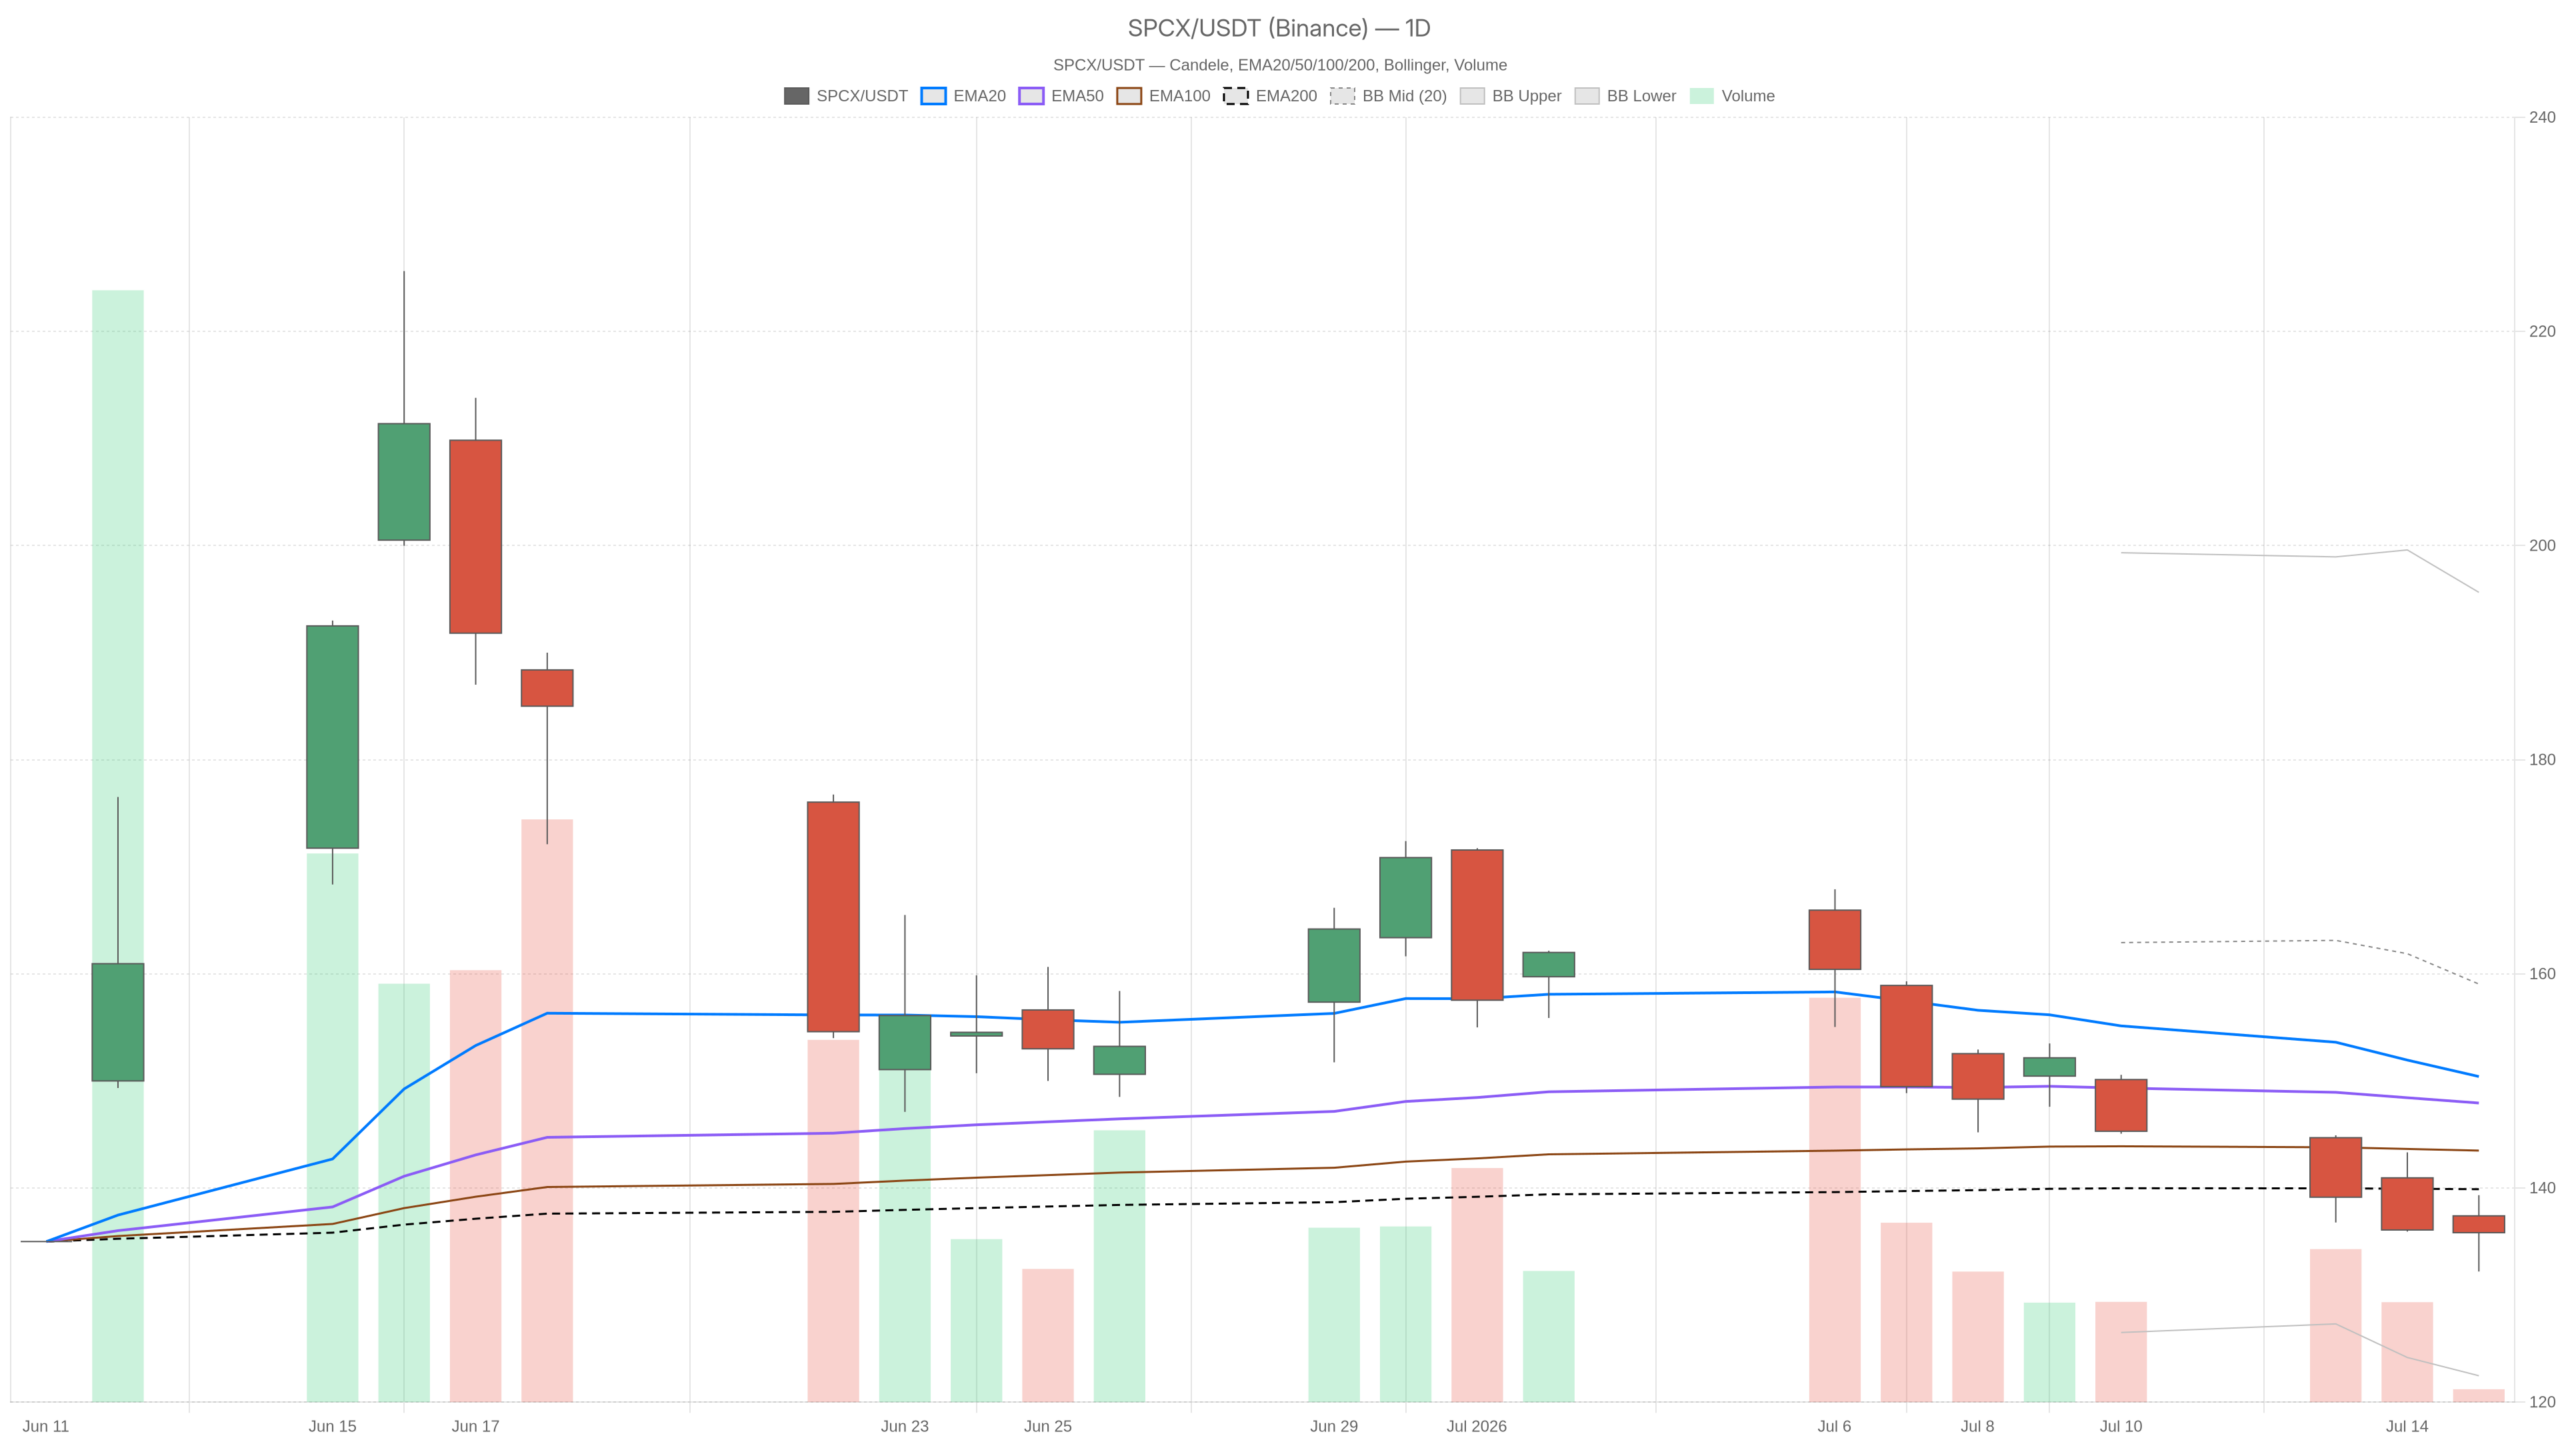
Space Exploration Technologies stock is navigating a difficult stretch. SPCX closed at $135.82 on July 15, below key moving averages with a daily RSI of 48.52 — a level that neither confirms recovery nor signals capitulation.
Key takeaways
- SPCX closed at $135.82 on July 15, trading below EMA20, EMA50, and EMA200 on the daily timeframe.
- The stock has fallen 35% from its peak and dropped roughly 9.7% over the past month alone.
- Daily MACD is deeply negative with a histogram of -3.81, while RSI at 48.52 confirms neither recovery nor capitulation.
- Key support sits at $132.24 (daily S1); a breakdown opens the path toward the Bollinger lower band at $122.46.
- A bullish reversal requires a daily close above $139.37, accompanied by RSI reclaiming 50 and MACD improving.
Daily Structure Confirms Bearish Momentum for Space Exploration Technologies Stock
On the daily chart, price at $135.82 trades below every major moving average. The EMA20 sits at $150.41, the EMA50 at $147.94, and even the EMA200 at $139.89 has become resistance rather than support. That gap reflects sustained selling pressure that has stripped away speculative froth.
Momentum Indicators Signal Deepening Weakness
The MACD on the daily frame is deeply negative. The MACD line reads -2.72 against a signal of 1.09, producing a histogram of -3.81. This divergence has been building, and no bullish reversal signal has emerged. Yet the regime tag sits at neutral — a classification that clashes with the weight of these momentum readings.
Bollinger Bands and Volatility Context
Meanwhile, Bollinger Bands add useful context. The midline is at $159.05, with the lower band at $122.46. Price tracks well below the midline and closer to the lower band. This confirms the move lower has been meaningful. Still, room remains before reaching an extreme oversold reading. ATR14 at 9.78 confirms elevated daily volatility, with swings of nearly $10 intraday staying well within normal range.
Pivot Analysis: Equilibrium at a Critical Level
Short-term precision comes from pivot analysis. The pivot point sits at $135.78 — almost exactly where price closed. R1 stands at $139.37 and S1 at $132.24. Price hovering at the pivot signals equilibrium. The next directional move will likely determine whether $132 becomes the next test or $139 returns to view.
Hourly Chart Reinforces the Bearish Thesis
The 1H timeframe does not soften the daily picture — it reinforces it. The hourly regime is explicitly tagged bearish, and the EMA alignment confirms why. Price at $135.81 trades below EMA20 ($139.15), EMA50 ($145.07), and EMA200 ($157.53). Every meaningful trend reference sits above price in a clean bearish structure.
Notably, RSI on the 1H reads 36.24, approaching oversold territory without triggering a bounce signal. This is the zone where oversold conditions can persist during trending declines. It should not be read as an automatic recovery catalyst. However, it does suggest short-side momentum may be running into diminishing returns at these levels.
The hourly MACD line (-3.24) and signal (-3.23) are nearly identical, with a histogram of -0.01. This near-perfect convergence means the rate of deterioration has at least paused. Whether this becomes genuine stabilization or a momentary plateau before the next leg lower remains the key question.
Hourly Bollinger Bands place price between the midline ($138.46) and the lower band ($133.12). The lower band marks the first significant horizontal area worth watching. ATR14 at 2.46 keeps volatility contained on this timeframe. Meanwhile, hourly pivot S1 at $134.78 serves as the nearest downside reference — a break below would shift intraday sentiment further negative.
15-Minute Chart Shows a Pause, Not a Reversal
On the 15-minute chart, a modest short-term development has emerged. The MACD histogram has turned slightly positive at 0.24, with the line (-0.88) crossing above the signal (-1.12). This is a micro-timeframe signal and should not be over-interpreted. It suggests immediate selling pressure has eased — not that a new trend is forming.
The 15m RSI at 47.4 remains neutral, with price sitting just above its EMA20 ($135.75). The regime is neutral on this frame. In context, SPCX has simply found a temporary floor near $135.50–$135.60. The 15m pivot at $135.74 acts as near-term balance. Resistance sits tight at R1 ($135.99), just 18 cents above the last close.
What a Bullish Reversal Would Require
A credible bullish case for Space Exploration Technologies stock demands a sequence of confirmations — not just a single bounce. First, price would need to reclaim the $139.37 daily R1 on a closing basis. That level aligns with the EMA200 on the daily frame, making it a meaningful structural test. A daily close above $139.89 would mark the first real signal of an attempted trend reversal.
On the fundamental side, the news flow already identifies potential drivers. Starlink profits, Starship progress, and AI ambitions are cited as reasons to maintain a hold-and-watch posture rather than exit outright. Should any of these catalysts crystallize into concrete announcements or earnings surprises, the multiple could be re-rated quickly. The stock’s high-beta profile after IPO means recovery moves tend to be sharp when they arrive.
Additionally, if the daily RSI moves back above 50 with improving price structure, that would confirm genuine momentum shift. A daily MACD histogram beginning to recover from its current extreme of -3.81 would further support that narrative.
The Bearish Case: Key Invalidation Levels
The bearish path remains the line of least resistance given current positioning. A break below daily S1 at $132.24 would represent clear deterioration. Below that, the Bollinger lower band at $122.46 becomes the next structural reference. This wide target reflects just how much room exists to the downside if support crumbles.
However, valuation remains the persistent overhang. Recent commentary specifically notes that SPCX looks overvalued even after the 10% pullback — a view echoed by Morgan Stanley and Jim Cramer. If that stance gains traction among institutional holders in a market not rewarding speculative premium, selling pressure could resurface. The IPO enthusiasm that drove the original run has visibly faded. No immediate technical catalyst exists to reignite it.
Meanwhile, the gap between current price and the daily EMA20 ($150.41) stands at nearly $15. That gap does not resolve quickly. It either compresses as price recovers slowly over time, or price drifts lower while the EMAs catch down. Both paths keep SPCX in a structurally challenged position for weeks, not days.
Positioning, Volatility, and the Road Ahead
Overall, SPCX presents a complex picture. The daily frame matters most, and it is bearish in structure despite a neutral regime tag. The hourly frame confirms the pressure. The 15-minute frame offers a tentative pause — a breath, not a reversal. Daily ATR near $10 ensures any position carries meaningful swing risk, and traders should size accordingly.
The $132–$136 range is the immediate battleground. A hold above $132.24 keeps the door open for stabilization. A failure below it accelerates the conversation toward the lower Bollinger Band. Until SPCX can close convincingly above $139 on the daily chart — ideally with improving MACD and RSI reclaiming 50 — the weight of the evidence remains with sellers. This is not a call to action but a clear-eyed read of where the market stands today.
FAQ
What is the current price of Space Exploration Technologies stock?
SPCX closed at $135.82 on July 15, trading below its EMA20 ($150.41), EMA50 ($147.94), and EMA200 ($139.89) on the daily timeframe.
Is Space Exploration Technologies stock bearish or bullish right now?
The dominant bias is bearish. The daily MACD histogram sits at -3.81, RSI reads 48.52, and price trades below all major moving averages. The hourly chart reinforces this with an explicitly bearish regime tag.
What are the key support levels for SPCX?
Immediate support sits at daily S1 of $132.24. Below that, the Bollinger lower band at $122.46 becomes the next structural reference. The $132–$136 range represents the immediate battleground.
What would signal a bullish reversal for Space Exploration Technologies stock?
A credible reversal requires a daily close above $139.37 (daily R1), followed by a move above the EMA200 at $139.89. The daily RSI would also need to reclaim 50, while the MACD histogram begins recovering from its current extreme of -3.81.
Disclaimer: This article is for informational purposes only and does not constitute financial advice, an investment recommendation, or a solicitation to buy or sell any financial instrument or cryptocurrency. The analysis provided is not indicative of future results. Investing in crypto assets and financial markets carries a high risk of capital loss. Always do your own research (DYOR) and consult a qualified financial advisor before making any decision.
Article produced with the assistance of artificial intelligence and reviewed by the editorial team.