



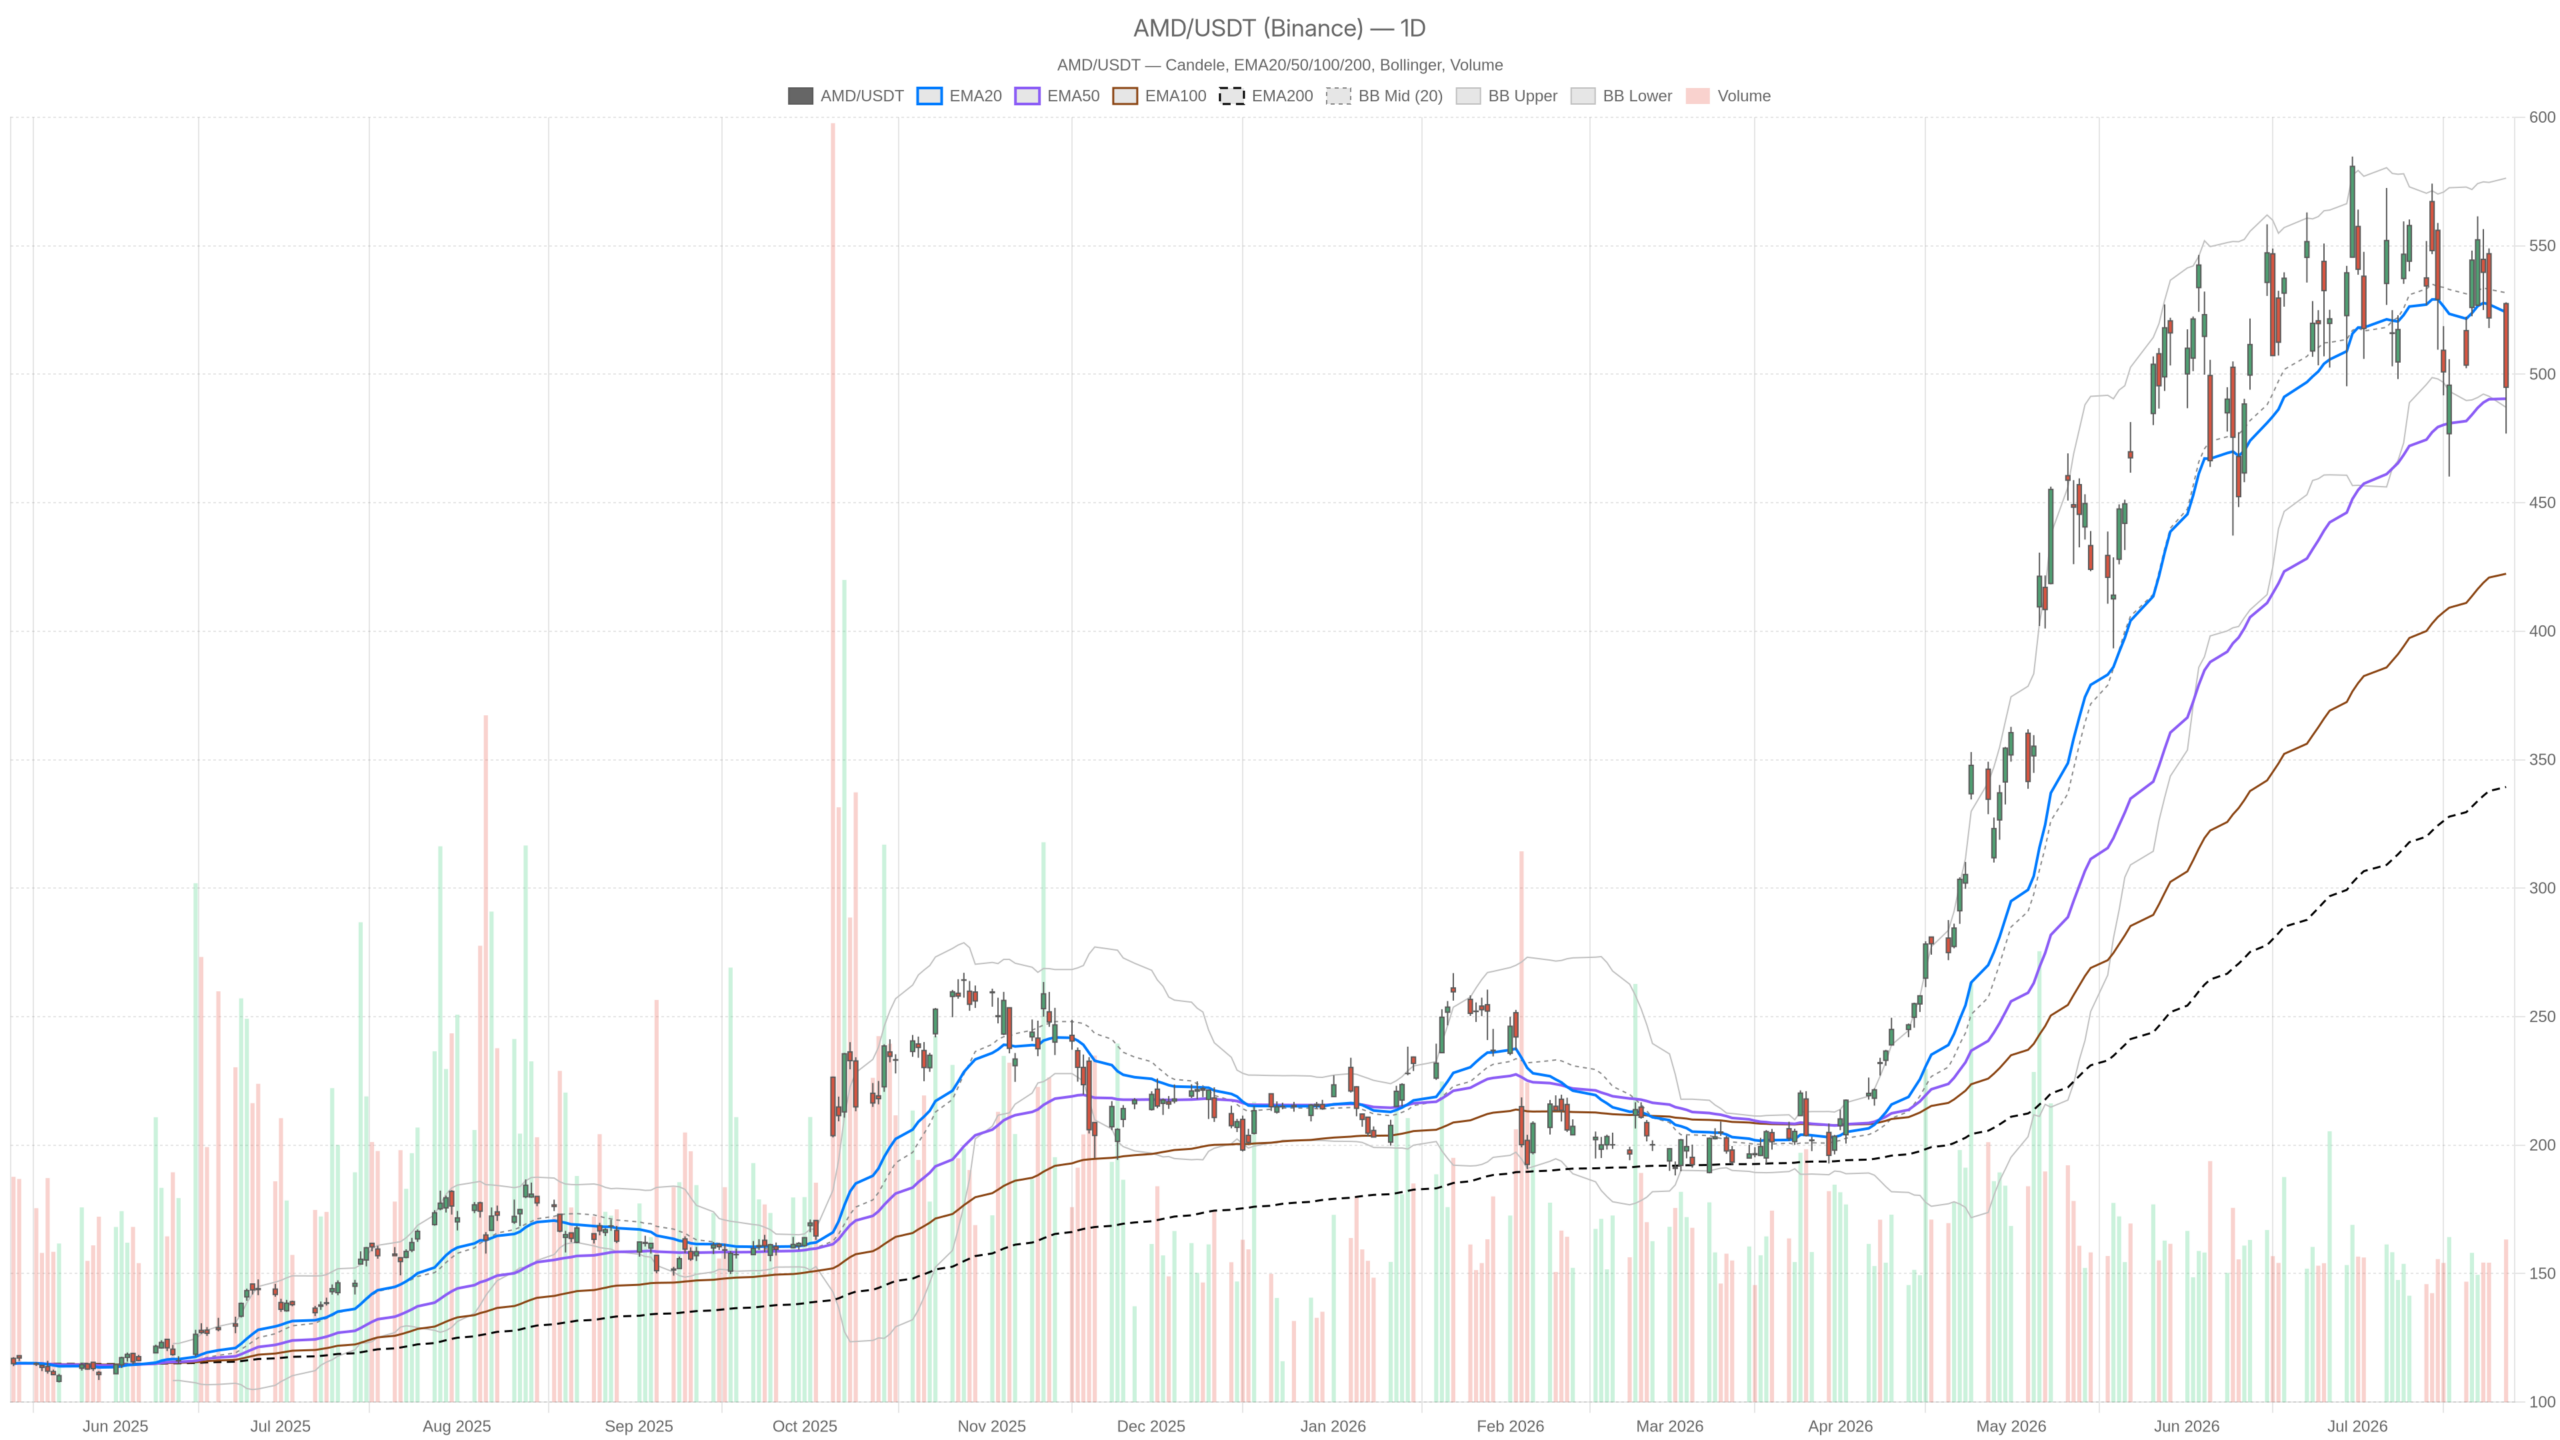
Advanced Micro Devices stock closed at $494.95 on July 27, well off its $528 intraday high. The price now tests the lower daily Bollinger Band at $487.14, while softening momentum signals suggest the bulls are losing near-term control ahead of earnings.
Key takeaways
- AMD closed at $494.95 on July 27, hovering just above the daily lower Bollinger Band at $487.14.
- The daily MACD has triggered a bearish crossover, while the RSI at 45.24 trends toward oversold territory.
- The hourly chart shows a fully bearish EMA stack, with all three moving averages aligned above price.
- The EMA50 at $490.48 and S1 pivot at $471.92 define the critical support zones to watch.
- Earnings and the Helios rack-scale AI launch represent potential catalysts for a re-rating.
Advanced Micro Devices Stock Stalls at a Critical Juncture
Advanced Micro Devices stock has lost near-term momentum. The shares are now compressing against the EMA50 at $490.48 after a sharp rejection from the $528 intraday high.
Still, the broader structural picture remains intact. AMD trades comfortably above its EMA200 at $339.39. This confirms the long-term uptrend is undamaged.
However, the stock has slipped below its EMA20 at $524.14. It now sits barely above the EMA50 at $490.48. That compression between price and the 50-day moving average is the defining tension right now. A decisive break below $490 would shift the daily bias meaningfully to the downside.
Daily Momentum: A Neutral Label Hiding Bearish Pressure
The daily momentum indicators paint a more cautious picture than the neutral regime label suggests. The RSI is drifting lower and the MACD has crossed bearishly.
Notably, the daily RSI stands at 45.24 — technically neutral, but trending toward oversold territory. No meaningful bounce has materialized. This reads more like a slow bleed than a reversal setup. The MACD histogram is negative at -4.93. The MACD line at 3.73 has crossed below the signal line at 8.66. This bearish crossover represents a meaningful deterioration in trend strength.
Meanwhile, the daily Bollinger Bands provide important framing. The midline sits at $531.73, well above current price. AMD closed at $494.95, beneath the midline and pressing toward the lower band at $487.14. This reflects a stock that has lost its expansionary momentum. A close below that lower band would be a genuine technical warning.
At the same time, the daily ATR of 36.42 signals elevated volatility and wide intraday swings. That reading alone demands respect from any short-term positioning strategy. This is not a low-volatility drift. AMD can move aggressively in either direction within a single session.
Pivot Levels Define the Immediate Battleground
Pivot levels show AMD closed below the daily pivot at $499.96. This is a mild bearish signal that puts support at $471.92 squarely in focus.
The daily pivot point sits at $499.96. AMD closed below it at $494.95. Resistance comes in at $522.99 (R1), while support is layered at $471.92 (S1). This gives the stock roughly $23 of downside before reaching the next structural support. That gap is meaningful given the current volatility environment.
On the 1-hour chart, the picture sharpens considerably. The H1 regime is explicitly bearish. Price at $495.07 sits well below the H1 EMA20 ($510.82), EMA50 ($521.53), and EMA200 ($524.12). All three EMAs are stacked in descending order above price. This is a classic bearish alignment. Intraday momentum is negative across every moving average reference.
The H1 MACD reinforces the point. The line is at -12.79 and the signal at -9.03. The histogram reads -3.76 and is still diverging. This is not a momentum setup showing exhaustion of selling. It is showing continuation. The H1 RSI at 38.45 is approaching oversold. However, in bearish trends, oversold conditions can persist longer than expected.
Short-Term Signals: A Flicker of Stabilization
The 15-minute chart offers a modest counterpoint to the broader bearish picture. The RSI has recovered to neutral and the MACD histogram has flipped positive.
The 15m RSI has recovered to 51.95 — essentially neutral. The MACD histogram has flipped positive at 3.15, even as the line remains negative at -3.61. This suggests a short-term stabilization attempt is underway. Price closed at $495.07, near the upper end of the 15m Bollinger Band at $495.03.
In contrast, this 15m recovery reads as tactical, not structural. It may indicate short-term buyers defending the $492–$493 area. The 15m pivot structure aligns tightly. Support sits at $492.99, the pivot at $494.48, and resistance at $496.57. AMD is currently trading right at its 15m pivot. This zone will likely dictate the next directional impulse in the very near term.
The Narrative Behind the Chart: Helios, Earnings, and Wall Street’s Measured Optimism
The fundamental story behind Advanced Micro Devices stock remains tied to the AI infrastructure race. The Helios rack-scale launch stands as a notable catalyst heading into earnings.
AMD recently launched its Helios rack-scale systems. This positions the company as a direct challenger to Nvidia in the AI infrastructure space. The strategic significance is real. Rack-scale AI deployment represents the next frontier of data center spending. Helios could meaningfully expand AMD’s addressable market.
However, Wall Street’s enthusiasm appears measured. With 41 buy ratings, the consensus price target implies only 9% upside from current levels. That is a relatively tight ceiling for a stock in the AI semiconductor space. Wedbush has also adjusted its price target ahead of earnings. This suggests analysts are recalibrating their models. At least some optimism appears tied to AMD’s AI revenue outlook.
Overall, the fundamental story has not broken down. The Helios launch keeps the AI narrative alive. Yet the market appears to be in a wait-and-see mode. It is unwilling to reprice AMD aggressively higher until earnings provide concrete revenue confirmation.
Bullish and Bearish Scenarios for AMD
Advanced Micro Devices stock faces a clear binary setup. The bullish case hinges on reclaiming the daily pivot, while the bearish path runs through the EMA50 and lower Bollinger Band.
The bullish case requires AMD to reclaim the $499.96 daily pivot. From there, it must push back toward the EMA20 at $524. A strong earnings report could be the trigger. Accelerating AI revenue would be particularly important. Helios traction metrics would further support a re-rating narrative. In that scenario, the upper Bollinger Band at $576.32 becomes the medium-term target. The EMA50 at $490.48 holding as support on a closing basis would also serve as an important early confirmation.
On the other hand, the bearish scenario unfolds if AMD closes below the EMA50 at $490.48. A subsequent break of the daily lower Bollinger Band at $487.14 would follow. The daily S1 pivot at $471.92 would then come into focus as the next meaningful support. Given the H1 bearish regime and the negative MACD structure across both daily and hourly frames, this path carries real technical weight. Disappointing earnings guidance — especially on AI revenue — would likely accelerate this move.
Positioning in a High-Volatility, Pre-Earnings Environment
Traders approaching Advanced Micro Devices stock must respect the elevated two-way risk. A daily ATR of 36.42 ahead of earnings leaves little room for complacency.
The daily ATR of 36.42 is not a number to ignore. It reflects a market capable of punishing poorly-timed positioning quickly. The technical bias leans cautiously bearish in the short term. This is based on the H1 structure and the daily MACD crossover. At the same time, the long-term uptrend remains structurally sound above the EMA200. A positive earnings catalyst could reframe the picture entirely.
Therefore, the dominant posture going into this week should be one of disciplined patience. The $490–$492 zone is the line in the sand for bulls. How AMD behaves around earnings will be decisive. More specifically, how the Helios story translates into quantifiable revenue will determine the resolution. Either the consolidation resolves higher, or it becomes a more meaningful corrective move.
FAQ
What are the key support levels for Advanced Micro Devices stock right now?
The immediate support is the EMA50 at $490.48, followed by the daily lower Bollinger Band at $487.14. A break below these would expose the S1 pivot at $471.92.
Is the long-term trend for AMD still intact?
Yes. AMD trades well above its EMA200 at $339.39, confirming the long-term uptrend remains structurally undamaged despite near-term weakness.
What catalyst could reverse the current bearish pressure on AMD?
A strong earnings report with accelerating AI revenue growth could trigger a reversal. Additionally, Helios rack-scale traction metrics would support a re-rating narrative.
What does the hourly chart indicate about AMD’s intraday momentum?
The H1 chart is explicitly bearish. All three EMAs (20, 50, 200) are stacked above price in descending order, and the MACD histogram continues to diverge negatively.
Disclaimer: This article is for informational purposes only and does not constitute financial advice, an investment recommendation, or a solicitation to buy or sell any financial instrument or cryptocurrency. The analysis provided is not indicative of future results. Investing in crypto assets and financial markets carries a high risk of capital loss. Always do your own research (DYOR) and consult a qualified financial advisor before making any decision.
Article produced with the assistance of artificial intelligence and reviewed by the editorial team.