



MongoDB, Inc. stock enters September at a crossroads. Q2 fiscal 2027 revenue hit $772 million, up 30% year-over-year, and management raised its full-year outlook. Yet shares tumbled anyway — creating a stark disconnect between fundamentals and price action.
Key takeaways
- MongoDB reported Q2 fiscal 2027 revenue of $772 million, a 30% year-over-year increase, and raised its full-year guidance.
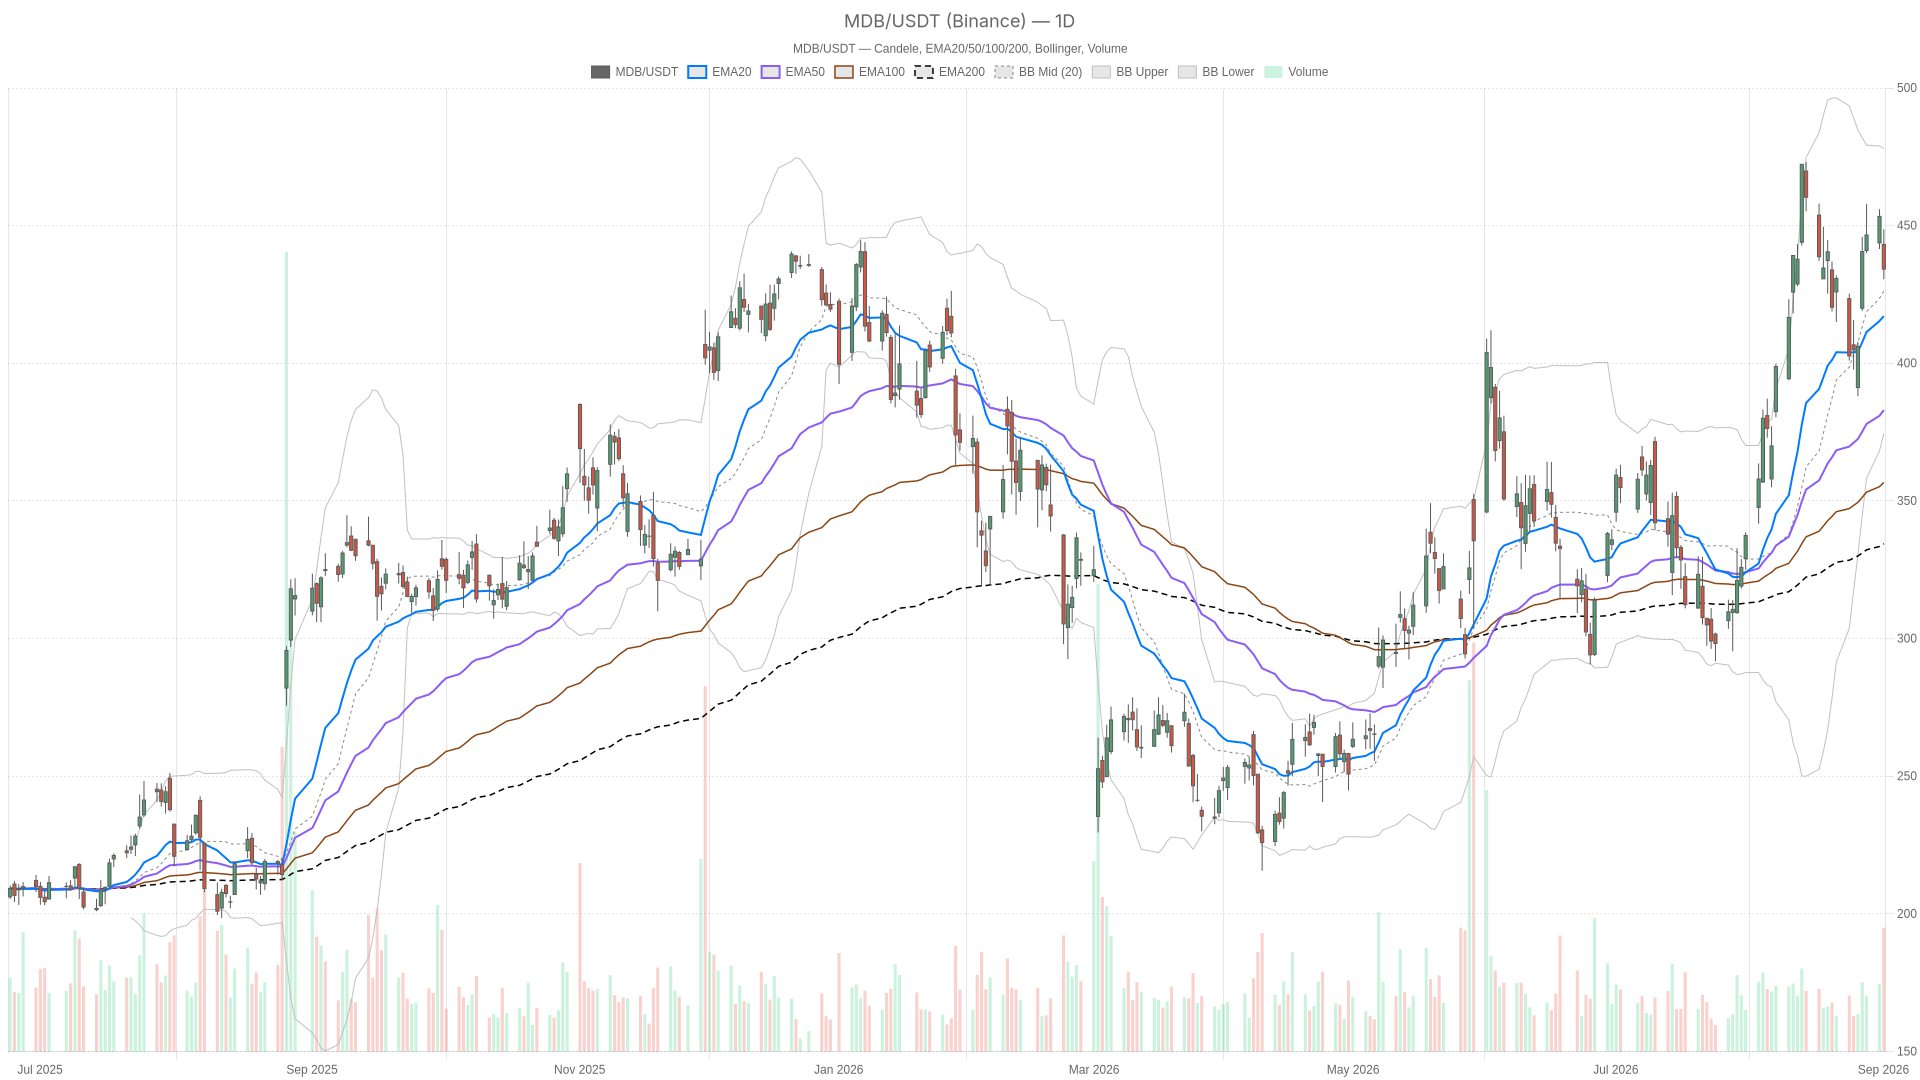
- MDB stock closed at $434.21, well below the session open of $443.19, forming a bearish intraday range despite the earnings beat.
- The daily trend remains bullish with price above the EMA20, EMA50, and EMA200, though a MACD bearish crossover is beginning to form.
- AI-related infrastructure costs and a risk-off macro backdrop drove profit-taking, not a fundamental deterioration in the business.
- Near-term resistance sits at $437.81 and $445.09, while key support holds at $426.93 and the EMA20 at $417.17.
MDB Stock Price: Daily Trend Remains Bullish, But Momentum Cools
MongoDB, Inc. stock maintains a structurally bullish daily trend — price holds above all three major moving averages — yet momentum indicators are beginning to flash early caution signals.
The daily close of $434.21 sits well below the session open of $443.19 and the intraday high of $448.68. This leaves a wide, bearish-looking range on an otherwise bullish earnings print. A beat-and-raise quarter followed by a sharp intraday reversal signals positioning and profit-taking, not business deterioration.
Price is trading above the EMA20 (417.17), EMA50 (383.03), and EMA200 (334.47). The indicator regime remains tagged bullish. That stacked EMA structure reflects a healthy uptrend that has been building for months.
However, momentum shows early signs of fatigue. The daily RSI14 sits at 57.78 — comfortably bullish but no longer stretched and well off overbought territory. More telling is the MACD: the MACD line at 20.15 has slipped below the signal at 21.73, producing a negative histogram of -1.59. This is the first hint of a bearish crossover forming on the daily timeframe, even as the broader trend stays up.
Bollinger Bands add further context. Price closed near the midline (426.25) rather than pressing the upper band (478.02), suggesting the recent rally still has room before becoming technically overextended. Meanwhile, the ATR14 of 22.49 confirms an unusually volatile session — consistent with an earnings-driven shakeout rather than routine trading.
At the same time, pivot levels reinforce the cautious read. The daily pivot point stands at 437.81, and MDB closed below it at 434.21, near the S1 support of 426.93. Closing under the pivot after an earnings beat is a subtle but real warning sign for near-term bulls.
MongoDB, Inc. Stock: Hourly Chart Adds a Layer of Caution
The hourly timeframe does not confirm the daily bullish regime — instead, it reveals a neutral-to-cautious picture where short-term momentum is clearly rolling over.
The indicator regime on the 1-hour chart reads neutral. Price at 435.29 sits below the EMA20 (439.21) yet still holds above the EMA50 (433.64). That is a mixed structure, not a clean uptrend continuation.
Momentum leans soft. RSI14 reads 47.16, just under the neutral 50 line. The MACD histogram has widened to -2.47, with the MACD line (1.48) trading well below its signal (3.95). In contrast to the daily chart’s still-bullish trend, the hourly momentum picture is clearly rolling over in the short term.
Bollinger Bands on the hourly chart show price hugging the lower band (431.84) rather than the midline (443.79). This points to persistent intraday selling pressure. Meanwhile, the hourly pivot sits at 434.13 — essentially where price is trading — leaving the market undecided between S1 support at 432.42 and R1 resistance at 437.01.
Overall, the conflict between timeframes is clear. The daily structure still favors buyers on a multi-month basis, yet the hourly momentum and regime signal digestion, not trend extension. That is a meaningful complication for anyone treating this purely as a bullish setup.
15-Minute Chart: Execution-Level Context
On the 15-minute timeframe, MDB stock sits in a tight, indecisive pocket between the pivot at 434.01 and R1 at 436.76 — not yet broken down, but not showing signs of a short-term reversal either.
Price at 435.29 trades below both the EMA20 (437.48) and EMA50 (440.00), though it remains above the EMA200 (433.98). This places MDB in a narrow zone rather than a clear directional move.
RSI14 on this timeframe reads 43.2 — still soft but not deeply oversold. Notably, the MACD histogram has ticked to a marginally positive 0.13, even though the MACD line (-1.92) remains below its signal (-2.05). This is a small, tentative sign of short-term stabilization, far from a confirmed reversal.
Price sits between the 15-minute pivot (434.01) and R1 (436.76), with the lower Bollinger Band at 431.84 nearby. Consequently, the immediate range is narrow. Short-term traders are watching whether buyers can reclaim 436.76 or whether sellers push back toward 432.54 support.
Why MDB Stock Tumbled Despite the Earnings Beat
MongoDB, Inc. stock fell after strong earnings because investors focused on rising AI infrastructure costs and a deteriorating macro backdrop — not on the revenue beat itself.
Reports note that MongoDB’s AI and infrastructure costs are weighing on shares even as revenue growth accelerates. This suggests investors are scrutinizing margin trajectory alongside topline strength. At the same time, broader market conditions did not help: Wall Street slipped into what has historically been its worst month, while oil prices and yields rose and debt-crisis concerns resurfaced.
Therefore, much of the drop looks tied to profit-taking after a strong run. It was layered on top of a risk-off macro backdrop. It does not reflect a fundamental deterioration in MongoDB’s business.
Bullish Scenario for MongoDB, Inc. Stock
The bullish case hinges on reclaiming the daily pivot at $437.81 and pushing through R1 at $445.09. That would signal the earnings-day reversal was merely a shakeout.
Support would need to hold above S1 at 426.93 to keep the broader EMA20/50/200 uptrend credible. On the hourly chart, a recovery back above the EMA20 (439.21) would help, and RSI pushing back over 50 would further confirm renewed buying interest. Meanwhile, a daily MACD histogram flipping positive again would validate that momentum is turning back in favor of the bulls.
Bearish Scenario Risks
The bearish case activates on a decisive break below the daily S1 at $426.93. That would open the door to a deeper pullback toward the EMA20 at $417.17.
A bearish daily MACD crossover confirming below the signal line would add weight to that scenario. On the hourly chart, continued trading below the EMA20 and EMA50 would keep the neutral-to-bearish short-term bias intact — and RSI staying under 50 reinforces that view. Furthermore, a slip below the 15-minute EMA200 at 433.98 would suggest sellers are gaining control of the immediate session.
Positioning and Volatility: The Bigger Picture
MongoDB, Inc. stock presents a classic conflict: a still-bullish daily trend collides with a cooling, neutral-to-cautious short-term picture, all against a backdrop of elevated volatility.
The daily ATR14 of 22.49 confirms that volatility has spiked sharply around this earnings release. That elevated volatility is likely to persist as the market digests both the strong 30% revenue growth and the concerns around AI-related infrastructure costs. Meanwhile, the broader macro backdrop of rising yields and oil prices adds another layer of uncertainty.
Overall, positioning here calls for patience. The long-term trend has not broken, but the near-term tug-of-war between profit-takers and trend-followers is far from resolved.
FAQ
Why did MongoDB stock fall after beating earnings?
Despite reporting Q2 fiscal 2027 revenue of $772 million — up 30% year-over-year — and raising full-year guidance, MongoDB, Inc. stock fell as investors focused on rising AI infrastructure costs and a risk-off macro backdrop marked by rising yields and oil prices. The decline reflects profit-taking rather than business deterioration.
Is MongoDB stock still in a bull trend?
Yes, the daily trend remains structurally bullish. MDB stock trades above the EMA20 (417.17), EMA50 (383.03), and EMA200 (334.47), with the indicator regime still tagged bullish. However, a MACD bearish crossover is beginning to form, signaling early momentum fatigue.
What are the key support levels for MDB stock?
Key support sits at the daily S1 pivot of $426.93. Below that, the EMA20 at $417.17 serves as the next meaningful reference point. On the 15-minute chart, the EMA200 at $433.98 provides immediate session-level support.
What is driving MongoDB’s revenue growth?
MongoDB’s growth is being driven by acceleration in both the Atlas cloud database platform and the Enterprise Advanced self-managed offering. Combined, these segments powered the 30% year-over-year revenue increase to $772 million in Q2 fiscal 2027.
Disclaimer: This article is for informational purposes only and does not constitute financial advice, an investment recommendation, or a solicitation to buy or sell any financial instrument or cryptocurrency. The analysis provided is not indicative of future results. Investing in crypto assets and financial markets carries a high risk of capital loss. Always do your own research (DYOR) and consult a qualified financial advisor before making any decision.
Article produced with the assistance of artificial intelligence and reviewed by the editorial team.